Marks and Spencer 1998 Annual Report Download - page 72
Download and view the complete annual report
Please find page 72 of the 1998 Marks and Spencer annual report below. You can navigate through the pages in the report by either clicking on the pages listed below, or by using the keyword search tool below to find specific information within the annual report.-
 1
1 -
2
-
3
-
4
-
5
-
6
-
7
-
8
-
9
-
10
-
11
-
12
-
13
-
14
-
15
-
16
-
17
-
18
-
19
-
20
-
21
-
22
-
23
-
24
-
25
-
26
-
27
-
28
-
29
-
30
-
31
-
32
-
33
-
34
-
35
-
36
-
37
-
38
-
39
-
40
-
41
-
42
-
43
-
44
-
45
-
46
-
47
-
48
-
49
-
50
-
51
-
52
-
53
-
54
-
55
-
56
-
57
-
58
-
59
-
60
-
61
-
 62
62 -
 63
63 -
 64
64 -
 65
65 -
 66
66 -
 67
67 -
 68
68 -
 69
69 -
 70
70 -
 71
71 -
 72
72 -
 73
73 -
 74
74 -
 75
75 -
 76
76
 |
 |

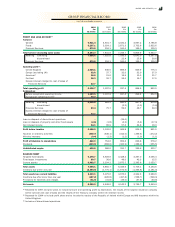
1998 1997 1996 1995 1994
£m £m £m £m £m
52 weeks 52 weeks 52 weeks 52 weeks 53 weeks
CASH FLOW( 1) (2)
Net cash inflow from operating activities 957.2 897.1 798.4 908.8 885.2
Returns on investments and servicing of finance 56.1 65.4 55.7 29.8 16.8
Tax ation (342.3) (318.6) (296.8) (273.4) (231.8)
Capital expenditure and financial investment (777.8) (413.1) (319.4) (387.8) (278.2)
Acquisitions and disposals 2.6 (0.2) (4.9) (9.6) (1.4)
Equity dividends paid (325.8) (305.6) (271.3) (248.1) (214.4)
Cash (outflow)/inflow before management of liquid
resources and financing (430.0) (75.0) (38.3) 19.7 176.2
Management of liquid resources 226.6 91.3 (127.7) (15.7) Ð(2)
Financing 307.4 64.7 113.5 15.6 Ð( 2)
Increase/(decrease) in cash 104.0 81.0 (52.5) 19.6 Ð(2)
Decrease/(increase) in net funds defined by FRS1 380.8 35.5 4.3 (30.4) (210.4)
KEY PERFORMANCE MEASURES
Gross profit
Gross margin( 3)(4) 35.2% 34.9% 34.7% 35.0% 35.0%
Turnover
Operating profit
Net margin( 3)(4) (6) 13.3% 13.2% 13.0% 13.2% 13.1%
Turnover
Net margin ex cluding exceptional income( 5) 12.6%
Profit before tax
Profitability (3) 14.2% 14.1% 13.8% 13.7% 13.1%
Turnover
Profitability excluding ex ceptional income( 5) 13.5%
Standard earnings( 7)
Earnings per share 29.1p 26.7p 23.3p 22.4p 20.9p
(Defined by FRS3) Weighted average ordinar y
shares in issue
FRS3 Earnings per share adjusted for exceptional income 27.8p
Headline earnings( 8)
Earnings per share 29.2p 26.8p 24.3p 22.6p 21.5p
(Defined by IIMR) Weighted average ordinary
shares in issue
IIMR Earnings per share adjusted for ex ceptional income 27.9p
Dividend per share 14.3p 13.0p 11.4p 10.3p 9.2p
Profit attributable to shareholders
Dividend cover 2.0 2.0 2.0 2.2 2.3
Dividends
Profit after tax and minority interests
Return on equity ( 3) 17.3% 17.5% 17.4% 17.8% 18.5%
Average shareholdersÕ funds
Capital expenditure £739.7m £425.6m £303.3m £366.9m £343.5m
(1) Figures for 1996 and prior years have been restated in accordance with the revised version of FRS1 ÔCash flow statementsÕ.
(2) Figures for 1994 are not readily available.
(3) Based on results reported as continuing operations.
(4) Based on segmental results.
(5) Figures for 1998 ex clude ex ceptional operating income of £53.2m in respect of VAT.
(6) Restated for 1994 to include profit share.
(7) Standard earnings are defined as profit after tax , minority interests and preference dividends.
(8) Headline earnings are standard earnings adjusted for cer tain capital items.
GRO UP FINAN CIAL RECO RD
FOR THE Y EA R ENDED 31 MARCH
70