Marks and Spencer 1998 Annual Report Download - page 61
Download and view the complete annual report
Please find page 61 of the 1998 Marks and Spencer annual report below. You can navigate through the pages in the report by either clicking on the pages listed below, or by using the keyword search tool below to find specific information within the annual report.-
 1
1 -
2
-
3
-
4
-
5
-
6
-
7
-
8
-
9
-
10
-
11
-
12
-
13
-
14
-
15
-
16
-
17
-
18
-
19
-
20
-
21
-
22
-
23
-
24
-
25
-
26
-
27
-
28
-
29
-
30
-
31
-
32
-
33
-
34
-
35
-
36
-
37
-
38
-
39
-
40
-
41
-
42
-
43
-
44
-
45
-
46
-
47
-
48
-
49
-
50
-
 51
51 -
 52
52 -
 53
53 -
 54
54 -
 55
55 -
 56
56 -
 57
57 -
 58
58 -
 59
59 -
 60
60 -
 61
61 -
 62
62 -
 63
63 -
 64
64 -
 65
65 -
 66
66 -
 67
67 -
 68
68 -
 69
69 -
 70
70 -
 71
71 -
72
-
73
-
74
-
75
-
76
 |
 |

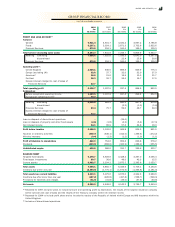
A TANGIBLE FIXED ASSETS
THE GROUP THE COMPANY
Assets A ssets
Fix tures, in the Fix tures, in the
Land & fittings & course of Land & fittings & course of
buildings equipment construction Total buildings equipment construction Total
£m £m £m £m £m £m £m £m
Cost or valuation
At 1 A pril 1997 3,148.6 1,103.9 53.1 4,305.6 2,783.0 837.4 26.5 3,646.9
Additions 297.7 177.9 264.1 739.7 284.9 148.8 172.2 605.9
Transfers 175.4 14.2 (189.6) –144.4 Ð (144.4) –
Disposals (9.9) (83.5) Ð (93.4) (5.5) (77.8) Ð (83.3)
Revaluation surplus 47.8 Ð Ð 47.8 47.8 Ð Ð 47.8
Differences on ex change (32.6) (22.8) (4.2) (59.6) ÐÐÐ –
At 31 March 1998 3,627.0 1,189.7 123.4 4,940.1 3,254.6 908.4 54.3 4,217.3
Accumulated depreciation
At 1 A pril 1997 91.9 603.8 Ð 695.7 46.4 472.9 Ð 519.3
Depreciation for the year 17.5 149.0 Ð 166.5 6.0 122.1 Ð 128.1
Disposals (3.5) (81.0) Ð (84.5) (0.1) (76.1) Ð (76.2)
Differences on ex change (2.3) (11.0) Ð (13.3) ÐÐÐ –
At 31 March 1998 103.6 660.8 – 764.4 52.3 518.9 – 571.2
Net book value
At 31 March 1998 3,523.4 528.9 123.4 4,175.7 3,202.3 389.5 54.3 3,646.1
At 31 March 1997 3,056.7 500.1 53.1 3,609.9 2,736.6 364.5 26.5 3,127.6
Analysis of land & buildings
THE GROUP THE COMPANY
Long Short Long Short
Freehold leasehold leasehold Total Freehold leasehold leasehold Total
£m £m £m £m £m £m £m £m
At valuation 1,074.3 438.2 13.5 1,526.0 1,074.3 438.2 13.5 1,526.0
At cost 1,278.7 548.2 274.1 2,101.0 1,062.4 543.8 122.4 1,728.6
2,353.0 986.4 287.6 3,627.0 2,136.7 982.0 135.9 3,254.6
Accumulated depreciation 8.5 1.4 93.7 103.6 2.7 1.4 48.2 52.3
Net book value
At 31 March 1998 2,344.5 985.0 193.9 3,523.4 2,134.0 980.6 87.7 3,202.3
At 31 March 1997 1,977.2 892.2 187.3 3,056.7 1,765.2 888.5 82.9 2,736.6
B INVESTMENT PROPERTIES
Freehold land and buildings include investment proper ties as follows
:
THE GROUP
THE COMPANY
£m £m
Cost or valuation
At 1 A pril 1997 146.5 146.5
Additions at cost 54.5 54.5
Revaluation surplus 47.8 47.8
At 31 March 1998 248.8 248.8
11 TANGIBLE FIXED ASSETS
NO TES TO TH E FIN AN CIAL STATEM EN TS
MA RKS A ND SPENCER p.l.c. 59