Marks and Spencer 1998 Annual Report Download - page 64
Download and view the complete annual report
Please find page 64 of the 1998 Marks and Spencer annual report below. You can navigate through the pages in the report by either clicking on the pages listed below, or by using the keyword search tool below to find specific information within the annual report.-
 1
1 -
2
-
3
-
4
-
5
-
6
-
7
-
8
-
9
-
10
-
11
-
12
-
13
-
14
-
15
-
16
-
17
-
18
-
19
-
20
-
21
-
22
-
23
-
24
-
25
-
26
-
27
-
28
-
29
-
30
-
31
-
32
-
33
-
34
-
35
-
36
-
37
-
38
-
39
-
40
-
41
-
42
-
43
-
44
-
45
-
46
-
47
-
48
-
49
-
50
-
51
-
52
-
53
-
 54
54 -
 55
55 -
 56
56 -
 57
57 -
 58
58 -
 59
59 -
 60
60 -
 61
61 -
 62
62 -
 63
63 -
 64
64 -
 65
65 -
 66
66 -
 67
67 -
 68
68 -
 69
69 -
 70
70 -
 71
71 -
 72
72 -
 73
73 -
 74
74 -
75
-
76
 |
 |

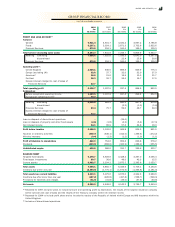
THE GROUP THE COMPANY
1998 1997 1998 1997
£m £m £m £m
Listed investments:
Government securities 54.8 96.1 –Ð
Listed in the United Kingdom 36.9 72.3 –Ð
Listed overseas 56.1 68.3 –Ð
Unlisted investments 94.5 125.1 –Ð
242.3 361.8 –Ð
Cash at bank includes commercial paper and shor t-term deposits with banks and other financial institutions.
THE GROUP
1998 1997
£m £m
Sterling
Cash deposits( 1) 267.1 342.0
Investments( 2) 182.9 208.5
Customer advances 1,572.2 1,308.1
US dollar
Cash deposits( 1) 243.3 107.9
Investments 88.7 161.6
Other 66.3 118.4
2,420.5 2,246.5
Analysed as:
Cash at bank and in hand 614.9 671.5
Less: non-interest bearing cash balances (55.2) (110.5)
559.7 561.0
Current asset investments 242.3 361.8
Customer advances 1,572.2 1,308.1
Fix ed asset investments 46.3 15.6
2,420.5 2,246.5
(1) Cash deposits comprise deposits placed with banks, financial institutions and on markets at call, 7 day and monthly rates.
(2) The investments comprise of both fixed and floating rate securities. The weighted average interest rate on the debt securities held is
7.79% (last year 7.23%) and the weighted average time for which the rate is fix ed is 3.34 years (last year 3.25 years).
THE GROUP THE COMPANY
1998 1997 1998 1997
£m £m £m £m
Bank loans, overdrafts and commercial paper 408.5 488.6 7.8 46.0
Other borrowings (see note 19B) 583.3 ЖÐ
Trade creditors 230.2 223.4 185.5 193.1
Amounts owed to Group undertakings –Ð162.4 5.5
Tax ation 353.3 356.8 324.5 325.8
Social security and other tax es 56.0 81.1 46.2 73.0
Other creditors( 1) 198.8 194.5 118.5 117.3
Accruals and deferred income 208.5 155.4 135.8 88.0
Proposed final dividend 306.4 275.3 306.4 275.3
2,345.0 1,775.1 1,287.1 1,124.0
(1) Other creditors include £18.9m (last year £8.9m) which is shown in the calculation of the GroupÕs net debt and is treated as financing
within the cash flow statement. These amounts are also included in the analysis of borrowings in note 19B.
17 CREDITORS: AMOUNTS FALLING DUE WITHIN ONE YEAR
15 CASH AT BANK AND IN HAND
16 INVESTMENTS IN INTEREST BEARING ASSETS
NO TES TO TH E FIN AN CIAL STATEM EN TS
62
14 CURRENT ASSET INVESTMENTS