Marks and Spencer 1998 Annual Report Download - page 69
Download and view the complete annual report
Please find page 69 of the 1998 Marks and Spencer annual report below. You can navigate through the pages in the report by either clicking on the pages listed below, or by using the keyword search tool below to find specific information within the annual report.-
 1
1 -
2
-
3
-
4
-
5
-
6
-
7
-
8
-
9
-
10
-
11
-
12
-
13
-
14
-
15
-
16
-
17
-
18
-
19
-
20
-
21
-
22
-
23
-
24
-
25
-
26
-
27
-
28
-
29
-
30
-
31
-
32
-
33
-
34
-
35
-
36
-
37
-
38
-
39
-
40
-
41
-
42
-
43
-
44
-
45
-
46
-
47
-
48
-
49
-
50
-
51
-
52
-
53
-
54
-
55
-
56
-
57
-
58
-
 59
59 -
 60
60 -
 61
61 -
 62
62 -
 63
63 -
 64
64 -
 65
65 -
 66
66 -
 67
67 -
 68
68 -
 69
69 -
 70
70 -
 71
71 -
 72
72 -
 73
73 -
 74
74 -
 75
75 -
 76
76
 |
 |

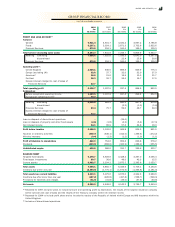
THE GROUP
1998 1997
£m £m
A RETURNS ON INVESTMENTS AND SERVICING OF FINANCE
Interest received 56.9 72.3
Interest paid –(6.1)
Dividends paid to minorities (0.8) (0.8)
Net cash inflow from returns on investments and servicing of finance 56.1 65.4
B TAXATION
UK corporation tax paid (330.8) (306.4)
Overseas tax paid (11.5) (12.2)
Net cash outflow for taxation (342.3) (318.6)
C CAPITAL EXPENDITURE AND FINANCIAL INVESTMENT
Purchase of tangible fix ed assets (753.3) (455.0)
Sale of tangible fix ed assets 6.1 21.4
Net (purchase)/ sale of fix ed asset investments (30.6) 20.5
Net cash outflow for capital expenditure and financial investment (777.8) (413.1)
D ACQUISITIONS AND DISPOSALS
Increase in investment in subsidiary by the minority 2.6 Ð
Disposal of joint venture –7.3
Increase in investment in joint venture –(7.5)
Net cash inflow/(outflow) for acquisitions and disposals 2.6 ( 0.2)
E MANAGEMENT OF LIQUID RESOURCES
Decrease in cash deposits treated as liquid resources 110.1 167.4
Net sale/ (purchase) of government securities 41.3 (78.7)
Net sale/ (purchase) of listed investments 47.6 (39.2)
Net sale of unlisted investments 27.6 41.8
Net cash inflow from decrease in liquid resources 226.6 91.3
F FINANCING
(Decrease)/ increase in bank loans, overdrafts and commercial paper treated as financing (31.7) 107.2
Issue of medium term notes 272.9 Ð
Repayment of 81Ú4% guaranteed bonds –(100.0)
Increase in other creditors treated as financing 17.3 13.8
Debt financing as shown in analysis of net debt (see note 30) 258.5 21.0
Shares issued under employeesÕ share schemes 48.9 43.7
Net cash inflow from financing 307.4 64.7
At 1 April Ex change
At 31 March
1997 Cash flow movement 1998
£m £m £m £m
Net cash:
Cash at bank and in hand (see note 16) 671.5 (46.6) (10.0) 614.9
Less: deposits treated as liquid resources (see below) (435.0) 110.1 5.3 (319.6)
236.5 63.5 (4.7) 295.3
Bank loans, overdrafts and commercial paper (see note 19B) (488.6) 72.2 7.9 (408.5)
Less: amounts treated as financing (see below) 386.9 (31.7) (3.3) 351.9
(101.7) 40.5 4.6 (56.6)
Net cash per cash flow statement 134.8 104.0 (0.1) 238.7
Liquid resources:
Deposits included in cash (see above) 435.0 (110.1) ( 5.3) 319.6
Current asset investments (see note 14) 361.8 (116.5) (3.0) 242.3
Liquid resources per cash flow statement and note 29E 796.8 (226.6) (8.3) 561.9
Debt financing:
Bank loans, overdrafts and commercial paper treated as financing (see above) (386.9) 31.7 3.3 (351.9)
73Ú8% Guaranteed bonds (see note 19B) (150.0) Ð Ð (150.0)
US$ Promissory note (see note 19B) (274.1) Ð 5.4 (268.7)
Medium term notes (see note 19B) Ð (272.9) Ð (272.9)
Other creditors (see note 19B) (59.1) (17.3) Ð (76.4)
Debt financing (see note 29F) (870.1) (258.5) 8.7 ( 1,119.9)
Net funds/(debt) 61.5 (381.1) 0.3 (319.3)
29 ANALYSIS OF CASH FLOWS GIVEN IN THE CASH FLOW STATEMENT
30 ANALYSIS OF NET DEBT
NO TES TO TH E FIN AN CIAL STATEM EN TS
MA RKS A ND SPENCER p.l.c. 67