Marks and Spencer 1998 Annual Report Download - page 71
Download and view the complete annual report
Please find page 71 of the 1998 Marks and Spencer annual report below. You can navigate through the pages in the report by either clicking on the pages listed below, or by using the keyword search tool below to find specific information within the annual report.-
 1
1 -
2
-
3
-
4
-
5
-
6
-
7
-
8
-
9
-
10
-
11
-
12
-
13
-
14
-
15
-
16
-
17
-
18
-
19
-
20
-
21
-
22
-
23
-
24
-
25
-
26
-
27
-
28
-
29
-
30
-
31
-
32
-
33
-
34
-
35
-
36
-
37
-
38
-
39
-
40
-
41
-
42
-
43
-
44
-
45
-
46
-
47
-
48
-
49
-
50
-
51
-
52
-
53
-
54
-
55
-
56
-
57
-
58
-
59
-
60
-
 61
61 -
 62
62 -
 63
63 -
 64
64 -
 65
65 -
 66
66 -
 67
67 -
 68
68 -
 69
69 -
 70
70 -
 71
71 -
 72
72 -
 73
73 -
 74
74 -
 75
75 -
 76
76
 |
 |

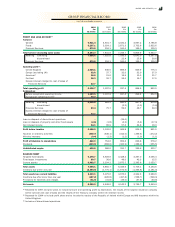
1998 1997 1996 1995 1994
£m £m £m £m £m
52 weeks 52 weeks 52 weeks 52 weeks 53 weeks
PROFIT AND LOSS ACCOUNT( 1)
Turnover:
General 4,811.4 4,601.7 4,181.4 3,967.2 3,785.8
Foods 3,157.1 3,024.1 2,871.3 2,703.6 2,632.6
Financial Services 274.8 216.1 181.0 139.1 125.3
Total turnover (excluding sales taxes) 8,243.3 7,841.9 7,233.7 6,809.9 6,543.7
Retailing Ð continuing 7,968.5 7,625.8 7,030.3 6,645.0 6,387.8
Ð discontinued –Ð 22.4 25.8 30.6
Financial Services 274.8 216.1 181.0 139.1 125.3
Operating profit(2):
United Kingdom 1,026.1 946.5 865.5 829.9 775.4
Europe (ex cluding UK) 32.8 37.7 32.0 32.0 37.9
Americas( 3) 16.8 21.0 13.9 13.3 21.7
Far East 18.3 32.7 26.0 19.7 17.5
Excess interest charged to cost of sales of
Financial Services 22.7 ÐÐÐÐ
Total operating profit 1,116.7 1,037.9 937.4 894.9 852.5
Analysed as:
Before exceptional operating income 1,063.5 1,037.9 937.4 894.9 852.5
Exceptional operating income 53.2 ÐÐÐÐ
Retailing Ð continuing 1,004.6 962.2 880.6 847.4 814.8
Ð discontinued –Ð (2.2) (1.2) (1.6)
Financial Services 89.4 75.7 59.0 48.7 39.3
Excess interest charged to cost of sales of
Financial Services 22.7 ÐÐÐÐ
Loss on disposal of discontinued operations –Ð (25.0) Ð Ð
Loss on disposal of proper ty and other fix ed assets (2.8) (1.8) (4.2) (5.4) (17.3)
Net interest income 54.1 65.9 57.6 34.8 16.3
Profit before taxation 1,168.0 1,102.0 965.8 924.3 851.5
Tax ation on ordinary activities (338.7) (346.1) (312.0) (299.5) (272.2)
Minority interests (0.4) (1.3) (1.2) (1.0) (1.1)
Profit attributable to shareholders 828.9 754.6 652.6 623.8 578.2
Dividends (409.1) (368.6) (320.9) (288.2) (255.5)
Undistributed surplus 419.8 386.0 331.7 335.6 322.7
BALANCE SHEET
Tangible fixed assets 4,175.7 3,609.9 3,428.4 3,297.0 3,095.4
Fix ed asset investments 69.7 36.6 46.0 43.3 15.5
Current assets 3,402.7 3,204.2 2,875.5 2,365.8 2,053.7
Total assets 7,648.1 6,850.7 6,349.9 5,706.1 5,164.6
Creditors due within one year (2,345.0) (1,775.1) (1,674.9) (1,363.8) (1,181.0)
Total assets less current liabilities 5,303.1 5,075.6 4,675.0 4,342.3 3,983.6
Creditors due after more than one year (187.2) (495.8) (497.8) (568.7) (599.3)
Provisions for liabilities and charges ( 31.0) ( 31.8) (35.0) (37.9) (40.9)
Net assets 5,084.9 4,548.0 4,142.2 3,735.7 3,343.4
(1) Restated for 1997 and prior years to include turnover and operating profit by destination, the results of the Captive insurance company
within turnover and cost of sales and the results of the Treasury company within net interest income.
(2) Restated for 1994 to include profit share and to include the results of the Republic of Ireland within Europe and MS Insurance within the
United Kingdom.
(3) Inclusive of discontinued operations.
GRO UP FINAN CIAL RECO RD
FOR THE Y EA R ENDED 31 MARCH
MA RKS A ND SPENCER p.l.c. 69