Logitech 2005 Annual Report Download - page 84
Download and view the complete annual report
Please find page 84 of the 2005 Logitech annual report below. You can navigate through the pages in the report by either clicking on the pages listed below, or by using the keyword search tool below to find specific information within the annual report.-
 1
1 -
2
-
3
-
4
-
5
-
6
-
7
-
8
-
9
-
10
-
11
-
12
-
13
-
14
-
15
-
16
-
17
-
18
-
19
-
20
-
21
-
22
-
23
-
24
-
25
-
26
-
27
-
28
-
29
-
30
-
31
-
32
-
33
-
34
-
35
-
36
-
37
-
38
-
39
-
40
-
41
-
42
-
43
-
44
-
45
-
46
-
47
-
48
-
49
-
50
-
51
-
52
-
53
-
54
-
55
-
56
-
57
-
58
-
59
-
60
-
61
-
62
-
63
-
64
-
65
-
66
-
67
-
68
-
69
-
70
-
71
-
72
-
73
-
 74
74 -
 75
75 -
 76
76 -
 77
77 -
 78
78 -
 79
79 -
 80
80 -
 81
81 -
 82
82 -
 83
83 -
 84
84 -
 85
85 -
 86
86 -
 87
87 -
 88
88 -
 89
89 -
 90
90 -
 91
91 -
 92
92 -
 93
93 -
 94
94 -
95
-
96
-
97
-
98
-
99
-
100
-
101
-
102
-
103
-
104
-
105
-
106
-
107
-
108
-
109
-
110
-
111
-
112
-
113
-
114
-
115
-
116
-
117
-
118
-
119
-
120
-
121
-
122
-
123
-
124
-
125
-
126
-
127
-
128
-
129
-
130
-
131
-
132
-
133
-
134
-
135
-
136
-
137
-
138
-
139
-
140
-
141
-
142
-
143
 |
 |

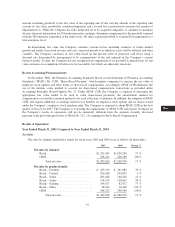
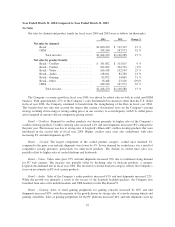
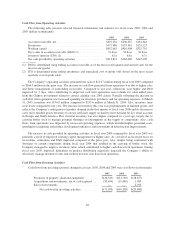
Cash Flow from Operating Activities
The following table presents selected financial information and statistics for fiscal years 2005, 2004 and
2003 (dollars in thousands):
2005 2004 2003
Accounts receivable, net ............................... $229,234 $206,187 $181,644
Inventories .......................................... $175,986 $135,561 $124,123
Working capital ...................................... $452,663 $410,908 $325,701
Days sales in accounts receivable (DSO) (1) ................ 51days 53days 54days
Inventory turnover (ITO) (2) ............................ 6.1x 6.8x 6.7x
Net cash provided by operating activities .................. $213,674 $166,460 $145,108
(1) DSO is determined using ending accounts receivable as of the most recent quarter-end and net sales for the
most recent quarter.
(2) ITO is determined using ending inventories and annualized cost of goods sold (based on the most recent
quarterly cost of goods sold).
The Company’s operating activities generated net cash of $213.7 million during fiscal year 2005 compared
to $166.5 million in the prior year. The increase in cash flow generated from operations was due to higher sales
and better management of outstanding receivables. Compared to last year, collections were higher and DSO
improved by 2 days. Also contributing to improved cash from operations were refunds for value-added taxes
from the Chinese government related to certain calendar year 2003 claims. Partially offsetting the increase in
cash flow from operations was increased spending for inventory purchases and for operating expenses. At March
31, 2005, inventory was $176.0 million compared to $135.6 million at March 31, 2004. Also, inventory turns
were lower compared to last year. The increase in inventory this year was predominantly in finished goods, and
reflects the Company’s anticipation of product demand in the first quarter of fiscal year 2006 and its decision to
carry more finished goods inventory to ensure sufficient supply on hand to meet demand for key retail accounts
in Europe and North America. Raw material inventory was also higher compared to a year ago, largely due to
carrying buffer stock to manage potential shortages or interruptions in the supply of components. Also, cash
flows from operations was impacted by increased operating expenses, which included higher personnel costs,
spending for marketing and product development initiatives and investments in infrastructure improvements.
The increase in cash provided by operating activities in fiscal year 2004 compared to fiscal year 2003 was
primarily a result of improved working capital management on higher sales. As a result of an increased focus on
receivables, collections and DSO improved compared to the prior year. Also, despite being confronted with
shortages of certain components during fiscal year 2004 that resulted in the carrying of buffer stock, the
Company managed to improve inventory turns, which contributed to higher cash flows from operations. During
fiscal year 2003, logistical difficulties in product distribution negatively impacted the Company’s ability to
effectively manage inventory levels and resulted in lower cash flow from operations.
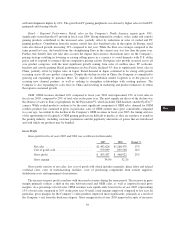
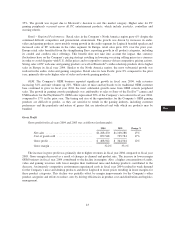
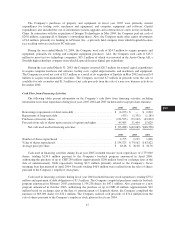
Cash Flow from Investing Activities
Cash flows from investing activities during fiscal years 2005, 2004 and 2003 were as follows (in thousands):
2005 2004 2003
Purchases of property, plant and equipment ......... $(40,541) $(24,718) $(28,657)
Acquisitions and investments, net of cash acquired .... (30,494) (15,490) 1,985
Sales of investments ............................ — — 2,072
Net cash used in investing activities ........... $(71,035) $(40,208) $(24,600)
46