Logitech 2005 Annual Report Download - page 83
Download and view the complete annual report
Please find page 83 of the 2005 Logitech annual report below. You can navigate through the pages in the report by either clicking on the pages listed below, or by using the keyword search tool below to find specific information within the annual report.-
 1
1 -
2
-
3
-
4
-
5
-
6
-
7
-
8
-
9
-
10
-
11
-
12
-
13
-
14
-
15
-
16
-
17
-
18
-
19
-
20
-
21
-
22
-
23
-
24
-
25
-
26
-
27
-
28
-
29
-
30
-
31
-
32
-
33
-
34
-
35
-
36
-
37
-
38
-
39
-
40
-
41
-
42
-
43
-
44
-
45
-
46
-
47
-
48
-
49
-
50
-
51
-
52
-
53
-
54
-
55
-
56
-
57
-
58
-
59
-
60
-
61
-
62
-
63
-
64
-
65
-
66
-
67
-
68
-
69
-
70
-
71
-
72
-
 73
73 -
 74
74 -
 75
75 -
 76
76 -
 77
77 -
 78
78 -
 79
79 -
 80
80 -
 81
81 -
 82
82 -
 83
83 -
 84
84 -
 85
85 -
 86
86 -
 87
87 -
 88
88 -
 89
89 -
 90
90 -
 91
91 -
 92
92 -
 93
93 -
94
-
95
-
96
-
97
-
98
-
99
-
100
-
101
-
102
-
103
-
104
-
105
-
106
-
107
-
108
-
109
-
110
-
111
-
112
-
113
-
114
-
115
-
116
-
117
-
118
-
119
-
120
-
121
-
122
-
123
-
124
-
125
-
126
-
127
-
128
-
129
-
130
-
131
-
132
-
133
-
134
-
135
-
136
-
137
-
138
-
139
-
140
-
141
-
142
-
143
 |
 |

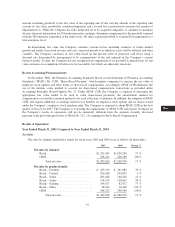
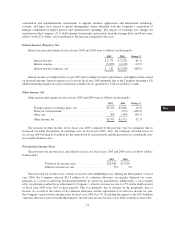
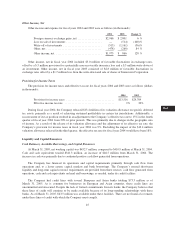
Other Income, Net
Other income and expense for fiscal years 2004 and 2003 were as follows (in thousands):
2004 2003 Change %
Foreign currency exchange gains, net ................. $2,966 $2,801 6%
Loss on sale of investments ......................... — (514) (100)%
Write-off of investments ........................... (515) (1,161) (56)%
Other,net ....................................... (478) (260) 84 %
Otherincome,net ................................ $1,973 $ 866 128%
Other income, net in fiscal year 2004 included $3.0 million of favorable fluctuations in exchange rates,
offset by a $.5 million provision for a potentially non-recoverable insurance loss and a $.5 million write-down of
an investment. Other income, net in fiscal year 2003 consisted of $2.8 million of favorable fluctuations in
exchange rates offset by a $1.7 million loss from the write-down and sale of shares of Immersion Corporation.
Provision for Income Taxes
The provision for income taxes and effective tax rate for fiscal years 2004 and 2003 were as follows (dollars
in thousands):
2004 2003
Provision for income taxes .................................. $13,516 $24,709
Effective income tax rate ................................... 9% 20%
During fiscal year 2004, the Company released $13.4 million of its valuation allowance on specific deferred
tax assets, primarily as a result of achieving sustained profitability in certain tax jurisdictions. Additionally, a
reassessment of its tax position resulted in an adjustment to the Company’s effective tax rate to 15% in the fourth
quarter of fiscal year 2004 from 20% in prior periods. This was primarily due to changes in the geographic mix
of income. As a result of the release of its valuation allowance and the adjustment of its effective tax rate, the
Company’s provision for income taxes in fiscal year 2004 was 9%. Excluding the impact of the $13.4 million
valuation allowance released in the third quarter, the effective tax rate for fiscal year 2004 would have been 18%.
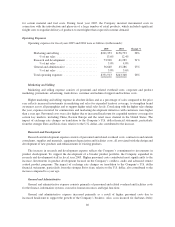
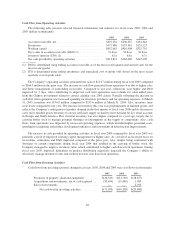
Liquidity and Capital Resources
Cash Balances, Available Borrowings, and Capital Resources
At March 31, 2005, net working capital was $452.7 million, compared to $410.9 million at March 31, 2004.
Cash and cash equivalents totaled $341.3 million, an increase of $46.5 million from March 31, 2004. The
increase in cash was primarily due to continued positive cash flow generated from operations.
The Company has financed its operations and capital requirements primarily through cash flow from
operations and, to a lesser extent, capital markets and bank borrowings. The Company’s normal short-term
liquidity and long-term capital resource requirements are provided from three sources: cash flow generated from
operations, cash and cash equivalents on hand and borrowings, as needed, under its credit facilities.
The Company had credit lines with several European and Asian banks totaling $73.3 million as of
March 31, 2005. As is common for businesses in European and Asian countries, these credit lines are
uncommitted and unsecured. Despite the lack of formal commitments from its banks, the Company believes that
these lines of credit will continue to be made available because of its long-standing relationships with these
banks. As of March 31, 2005, $63.5 million was available under these facilities. There are no financial covenants
under these lines of credit with which the Company must comply.
45
CG
20-F
LISA