Logitech 2005 Annual Report Download - page 81
Download and view the complete annual report
Please find page 81 of the 2005 Logitech annual report below. You can navigate through the pages in the report by either clicking on the pages listed below, or by using the keyword search tool below to find specific information within the annual report.
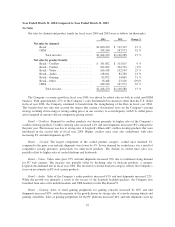
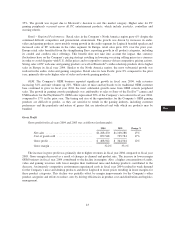
35%. The growth was in part due to Microsoft’s decision to exit this market category. Higher sales for PC
gaming peripherals occurred across all PC entertainment products, which include joysticks, controllers and
steering wheels.
Retail – Regional Performance. Retail sales in the Company’s North America region grew 6% despite the
continued difficult competitive and promotional environment. The growth was driven by increases in audio,
video and gaming products, most notably strong growth in the audio segment for Logitech branded speakers and
increased sales of PC webcams in the video segment. In Europe, retail sales grew 18% over the prior year.
Europe retail sales benefited from the strengthening Euro, reporting growth in all product categories, including
its corded and cordless mice offerings. This benefit does not take into account the impact that currency
fluctuations have on the Company’s pricing strategy resulting in lowering or raising selling prices in a currency
in order to avoid disparity with U.S. dollar prices and to respond to currency-driven competitive pricing actions.
Strong sales of PC webcams and gaming products as well as Bluetooth®cordless desktop products drove higher
sales in Europe in fiscal year 2004. Similar to the North America region, the most substantial growth was
realized in the audio, video and gaming categories. Retail sales in Asia Pacific grew 8% compared to the prior
year, primarily driven by higher sales of video and console gaming products.
OEM. The Company’s OEM business reported significant growth in fiscal year 2004, with revenues
increasing 32% and unit volumes up 22%. While sales of mice and keyboards to its traditional OEM customer
base continued to grow in fiscal year 2004, the most substantial growth came from OEM console peripheral
sales. The growth in gaming console peripherals was attributable to sales to Sony of the EyeToy™camera and
USB headsets for the PlayStation®2. OEM sales represented 20% of the Company’s net sales in fiscal year 2004,
compared to 17% in the prior year. The timing and size of the opportunities for the Company’s OEM gaming
products are difficult to predict, as they are sensitive to trends in the gaming industry, including customer
preferences and the popularity and nature of games that are introduced and with which are products may be
bundled.
Gross Profit
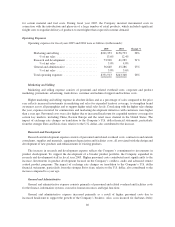
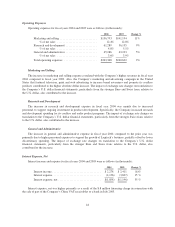
Gross profit for fiscal years 2004 and 2003 was as follows (in thousands):
2004 2003 Change %
Net sales ................................. $1,268,470 $1,100,288 15%
Cost of goods sold ......................... 859,548 735,784 17%
Grossprofit ............................... $ 408,922 $ 364,504 12%
Grossmargin.............................. 32.2% 33.1%
The increase in gross profit was primarily due to higher revenues in fiscal year 2004 compared to fiscal year
2003. Gross margin decreased as a result of changes in channel and product mix. The increase in lower margin
OEM business in fiscal year 2004 contributed to the decline in margins. Also, a higher concentration of audio,
video and gaming revenues with lower margins than traditional mice and desktop products contributed to the
decrease. An intensely competitive environment experienced early in fiscal year 2004 resulted in weak demand
for the Company’s mice and desktop products and drove Logitech to lower prices resulting in lower margins for
these product categories. This decline was partially offset by margin improvements for the Company’s other
product categories and efforts to reduce costs by driving efficiencies in product cost and distribution and logistics
management.
43
CG
20-F
LISA


