Logitech 2005 Annual Report Download - page 77
Download and view the complete annual report
Please find page 77 of the 2005 Logitech annual report below. You can navigate through the pages in the report by either clicking on the pages listed below, or by using the keyword search tool below to find specific information within the annual report.-
 1
1 -
2
-
3
-
4
-
5
-
6
-
7
-
8
-
9
-
10
-
11
-
12
-
13
-
14
-
15
-
16
-
17
-
18
-
19
-
20
-
21
-
22
-
23
-
24
-
25
-
26
-
27
-
28
-
29
-
30
-
31
-
32
-
33
-
34
-
35
-
36
-
37
-
38
-
39
-
40
-
41
-
42
-
43
-
44
-
45
-
46
-
47
-
48
-
49
-
50
-
51
-
52
-
53
-
54
-
55
-
56
-
57
-
58
-
59
-
60
-
61
-
62
-
63
-
64
-
65
-
66
-
 67
67 -
 68
68 -
 69
69 -
 70
70 -
 71
71 -
 72
72 -
 73
73 -
 74
74 -
 75
75 -
 76
76 -
 77
77 -
 78
78 -
 79
79 -
 80
80 -
 81
81 -
 82
82 -
 83
83 -
 84
84 -
 85
85 -
 86
86 -
 87
87 -
88
-
89
-
90
-
91
-
92
-
93
-
94
-
95
-
96
-
97
-
98
-
99
-
100
-
101
-
102
-
103
-
104
-
105
-
106
-
107
-
108
-
109
-
110
-
111
-
112
-
113
-
114
-
115
-
116
-
117
-
118
-
119
-
120
-
121
-
122
-
123
-
124
-
125
-
126
-
127
-
128
-
129
-
130
-
131
-
132
-
133
-
134
-
135
-
136
-
137
-
138
-
139
-
140
-
141
-
142
-
143
 |
 |

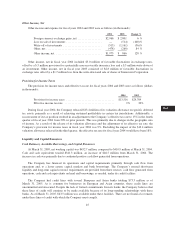
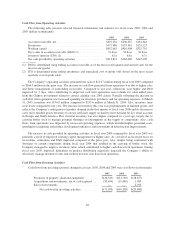
with unit shipments higher by 24%. The growth in PC gaming peripherals was driven by higher sales for both PC
gamepads and steering wheels.
Retail – Regional Performance. Retail sales in the Company’s North America region grew 30%,
significantly faster than the 6% growth in fiscal year 2004. Strong demand for cordless, video, audio and console
gaming products contributed to the increased sales, partially offset by reductions in sales of corded and PC
gaming products. Contribution from the remote control line also benefited sales in the region. In Europe, retail
sales also showed growth, increasing 32% compared to last year. While the Euro was stronger compared to the
same period last year, the benefit from the strengthening Euro in the current year was less than the prior year.
Further, this benefit does not take into account the impact that currency fluctuations have on the Company’s
pricing strategy resulting in lowering or raising selling prices in a currency to avoid disparity with U.S. dollar
prices and to respond to currency-driven competitive pricing actions. European sales growth occurred across all
core product categories, with the most significant growth coming from sales of cordless mice, PC webcams,
headsets and console gaming. Retail performance in Asia Pacific declined 3%, due to significantly lower sales in
China, partially offset by higher sales in Japan. Retail demand in Japan continued to be strong with growth
occurring across all core product categories. Despite the decline in sales in China, the Company is committed to
growing and expanding its presence there. To improve its distribution model, Logitech is in the process of
securing new channel partners, as well as seeking to strengthen relationships with existing partners. The
Company is also expanding its sales force in China and investing in marketing and product initiatives to return
the region to sustained growth.
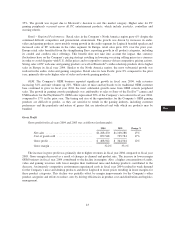
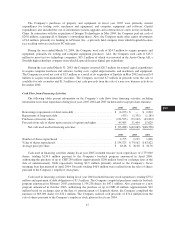
OEM. OEM revenues declined 24% compared to fiscal year 2004 and represented 13% of total sales in
fiscal year 2005, compared to 20% of total sales in the prior year. The most significant driver of the decline was
the absence of sales to Sony of peripherals for the Playstation®2, which included USB headsets and the EyeToy™
camera. While corded products continue to be the most significant component of OEM sales, demand for OEM
cordless products has continued to grow, in particular, sales of OEM cordless mice grew considerably compared
to a year ago. As evident by the decline in the Company’s OEM revenues in fiscal year 2005, the timing and size
of the opportunities for Logitech’s OEM gaming products are difficult to predict, as they are sensitive to trends in
the gaming industry, including customer preferences and the popularity and nature of games that are introduced
and with which our products may be bundled.
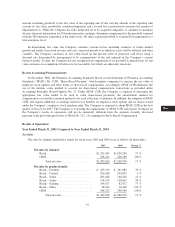
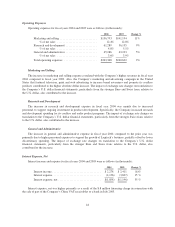
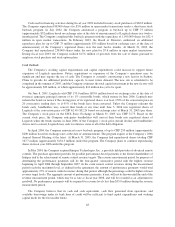
Gross Profit
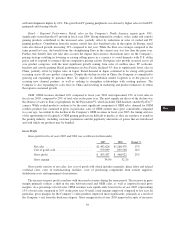
Gross profit for fiscal years 2005 and 2004 was as follows (in thousands):
2005 2004 Change %
Net sales ................................. $1,482,626 $1,268,470 17%
Cost of goods sold ......................... 979,039 859,548 14%
Grossprofit ............................... $ 503,587 $ 408,922 23%
Grossmargin.............................. 34.0% 32.2%
Gross profit consists of net sales, less cost of goods sold which includes materials, direct labor and related
overhead costs, costs of manufacturing facilities, costs of purchasing components from outside suppliers,
distribution costs and impairment of inventories.
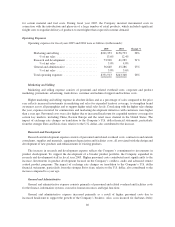
The increase in gross profit correlates with increased revenues during the same period. The increase in gross
margin primarily reflects a shift in the mix between retail and OEM sales, as well as improved retail gross
margins. As a percentage of total sales, OEM revenues were significantly lower in fiscal year 2005, representing
13% of total sales compared to 20% in the prior year. Overall, retail margins improved compared to last year. In
particular, gross margins for the Company’s video products improved most significantly, primarily as a result of
the Company’s exit from the dualcam category. Gross margin in fiscal year 2005 improved in spite of increases
39
CG
20-F
LISA