Logitech 2005 Annual Report Download - page 129
Download and view the complete annual report
Please find page 129 of the 2005 Logitech annual report below. You can navigate through the pages in the report by either clicking on the pages listed below, or by using the keyword search tool below to find specific information within the annual report.-
 1
1 -
2
-
3
-
4
-
5
-
6
-
7
-
8
-
9
-
10
-
11
-
12
-
13
-
14
-
15
-
16
-
17
-
18
-
19
-
20
-
21
-
22
-
23
-
24
-
25
-
26
-
27
-
28
-
29
-
30
-
31
-
32
-
33
-
34
-
35
-
36
-
37
-
38
-
39
-
40
-
41
-
42
-
43
-
44
-
45
-
46
-
47
-
48
-
49
-
50
-
51
-
52
-
53
-
54
-
55
-
56
-
57
-
58
-
59
-
60
-
61
-
62
-
63
-
64
-
65
-
66
-
67
-
68
-
69
-
70
-
71
-
72
-
73
-
74
-
75
-
76
-
77
-
78
-
79
-
80
-
81
-
82
-
83
-
84
-
85
-
86
-
87
-
88
-
89
-
90
-
91
-
92
-
93
-
94
-
95
-
96
-
97
-
98
-
99
-
100
-
101
-
102
-
103
-
104
-
105
-
106
-
107
-
108
-
109
-
110
-
111
-
112
-
113
-
114
-
115
-
116
-
117
-
118
-
 119
119 -
 120
120 -
 121
121 -
 122
122 -
 123
123 -
 124
124 -
 125
125 -
 126
126 -
 127
127 -
 128
128 -
 129
129 -
 130
130 -
 131
131 -
 132
132 -
 133
133 -
 134
134 -
 135
135 -
 136
136 -
 137
137 -
 138
138 -
 139
139 -
140
-
141
-
142
-
143
 |
 |

LOGITECH INTERNATIONAL S.A.
QUARTERLY FINANCIAL DATA
(Unaudited)
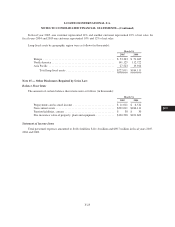
The following table contains selected unaudited quarterly financial data for fiscal years 2005 and 2004 (in
thousands except per share amounts):
Year ended March 31, 2005 Year ended March 31, 2004
First Second Third Fourth First Second Third Fourth
Net sales ......................... $266,594 $329,568 $483,816 $402,648 $218,192 $293,593 $409,557 $347,128
Gross profit ...................... 90,866 109,269 168,328 135,124 60,638 92,462 140,475 115,347
Operating expenses:
Marketing and selling .......... 39,569 49,233 61,020 51,531 28,032 39,483 47,751 41,527
Research and development ...... 16,679 17,503 19,160 20,558 14,595 14,541 15,582 16,571
General and administrative ...... 13,042 12,986 14,547 16,085 10,158 11,019 11,800 12,309
Total operating expense ..... 69,290 79,722 94,727 88,174 52,785 65,043 75,133 70,407
Operating income .................. 21,576 29,547 73,601 46,950 7,853 27,419 65,342 44,940
Net income ....................... $ 18,855 $ 25,989 $ 64,189 $ 40,233 $ 5,697 $ 21,204 $ 66,800 $ 38,452
Net income per share and ADS:
Basic ........................ $ .42 $ .59 $ 1.46 $ .91 $ .12 $ .46 $ 1.49 $ .85
Diluted ...................... $ .39 $ .54 $ 1.32 $ .83 $ .12 $ .44 $ 1.35 $ .78
Shares used to compute net income per
share and ADS:
Basic ........................ 44,828 44,112 43,829 44,226 45,743 45,669 44,879 45,117
Diluted ...................... 50,295 49,219 49,176 49,533 48,056 50,093 49,764 50,404
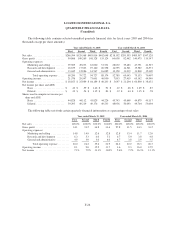
The following table sets forth certain quarterly financial information as a percentage of net sales:
Year ended March 31, 2005 Year ended March 31, 2004
First Second Third Fourth First Second Third Fourth
Net sales ............................ 100.0% 100.0% 100.0% 100.0% 100.0% 100.0% 100.0% 100.0%
Gross profit .......................... 34.1 33.2 34.8 33.6 27.8 31.5 34.3 33.2
Operating expenses:
Marketing and selling .............. 14.8 14.9 12.6 12.8 12.8 13.4 11.7 12.0
Research and development .......... 6.3 5.3 4.0 5.1 6.7 5.0 3.8 4.8
General and administrative .......... 4.9 3.9 3.0 4.0 4.7 3.8 2.9 3.5
Total operating expense ......... 26.0 24.2 19.6 21.9 24.2 22.2 18.3 20.3
Operating income ..................... 8.1 9.0 15.2 11.7 3.6 9.3 16.0 12.9
Net income .......................... 7.1% 7.9% 13.3% 10.0% 2.6% 7.2% 16.3% 11.1%
F-26