Food Lion 2006 Annual Report Download - page 87
Download and view the complete annual report
Please find page 87 of the 2006 Food Lion annual report below. You can navigate through the pages in the report by either clicking on the pages listed below, or by using the keyword search tool below to find specific information within the annual report.-
 1
1 -
2
-
3
-
4
-
5
-
6
-
7
-
8
-
9
-
10
-
11
-
12
-
13
-
14
-
15
-
16
-
17
-
18
-
19
-
20
-
21
-
22
-
23
-
24
-
25
-
26
-
27
-
28
-
29
-
30
-
31
-
32
-
33
-
34
-
35
-
36
-
37
-
38
-
39
-
40
-
41
-
42
-
43
-
44
-
45
-
46
-
47
-
48
-
49
-
50
-
51
-
52
-
53
-
54
-
55
-
56
-
57
-
58
-
59
-
60
-
61
-
62
-
63
-
64
-
65
-
66
-
67
-
68
-
69
-
70
-
71
-
72
-
73
-
74
-
75
-
76
-
 77
77 -
 78
78 -
 79
79 -
 80
80 -
 81
81 -
 82
82 -
 83
83 -
 84
84 -
 85
85 -
 86
86 -
 87
87 -
 88
88 -
 89
89 -
 90
90 -
 91
91 -
 92
92 -
 93
93 -
 94
94 -
 95
95 -
 96
96 -
 97
97 -
98
-
99
-
100
-
101
-
102
-
103
-
104
-
105
-
106
-
107
-
108
-
109
-
110
-
111
-
112
-
113
-
114
-
115
-
116
 |
 |

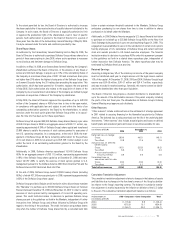
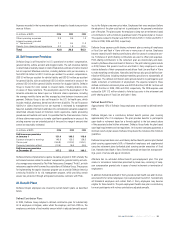
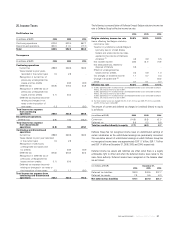
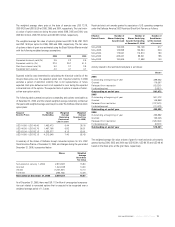
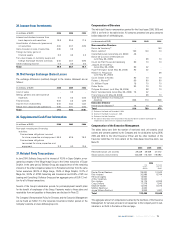
The asset portfolio of Delhaize Belgium’s defined benefit pension plan is funded
through a group insurance program. The plan assets, which benefit from a guaran-
teed minimum return, are part of the insurance company’s overall investment. The
market-related value of the plan assets is determined using the fair market value
approach. The insurance company’s asset allocation was as follows:
December 31,
2006 2005 2004
Equities 12% 10% 12%
Debt 69% 64% 62%
Real estate 4% 8% 6%
Other assets 15% 18% 20%
In 2007, Delhaize Belgium expects to contribute EUR 6.0 million to the defined
benefit pension plan.
The expected long-term rate of return for Delhaize Belgium’s defined benefit pen-
sion plan is based on the guaranteed return by the insurance company and the
expected insurance dividend.
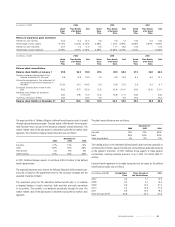
The investment policy for the Hannaford defined benefit plan is to maintain
a targeted balance of equity securities, debt securities and cash equivalents
in its portfolio. The portfolio is re-balanced periodically through the year. The
market-related value of the plan assets is determined using the fair market value
approach.
The plan’s asset allocation was as follows:
December 31,
2006 2005 2004
Equities 73% 72% 69%
Debt 23% 26% 29%
Cash equivalents 4% 2% 2%
The funding policy for the Hannaford defined benefit plan has been generally to
contribute the minimum required contribution and additional deductible amounts
at the sponsor’s discretion. In 2007, Delhaize Group expects to make pension
contributions, including voluntary amounts, of up to USD 12.0 million (EUR 9.1
million).
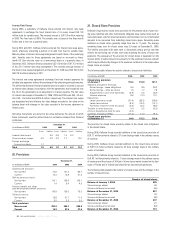
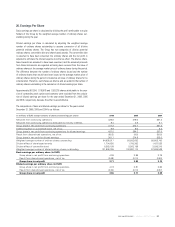
Expected benefit payments to be made during the next ten years for the defined
benefit pension plans are as follows:
(in millions of EUR) United States Plans Outside of Total
Plans the United States
2007 6.2 7.7 13.9
2008 6.3 5.7 12.0
2009 6.6 14.6 21.2
2010 6.4 10.8 17.2
2011 5.8 12.6 18.4
2012 through 2016 32.8 34.4 67.2
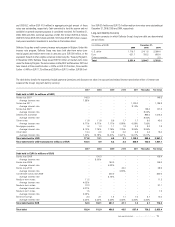
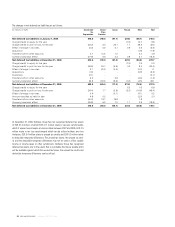
(in millions of EUR)
2006 2005 2004
United Plans Outside Total United Plans Outside Total United Plans Outside Total
States of the United States of the United States of the United
Plans States Plans States Plans States
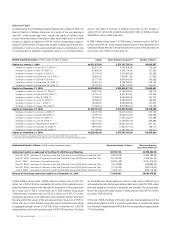
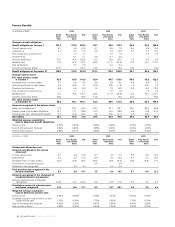
History of experience gains and losses:
Related to plan assets (4.4) 0.3 (4.1) 0.6 0.6 1.2 (1.5) 0.3 (1.2)
Percentage of plan assets -5.10% 0.44% -2.73% 0.68% 1.01% 0.85% -2.29% 0.50% -0.95%
Related to plan liabilities (2.7) 1.0 (1.7) 0.5 11.7 12.2 (1.0) - (1.0)
Percentage of plan liabilities -2.48% 0.84% -0.76% 0.45% 10.22% 5.18% -1.07% - -0.52%
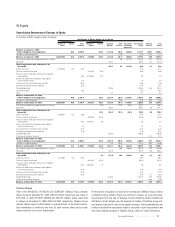
(in millions of EUR)
2006 2005 2004
United Plans Outside Total United Plans Outside Total United Plans Outside Total
States of the United States of the United States of the United
Plans States Plans States Plans States
Balance sheet reconciliation:
Balance sheet liability at January 1 39.5 54.3 93.8 29.5 38.9 68.4 31.5 34.8 66.3
Pension expense recognized in the
income statement in the year 8.5 6.8 15.3 7.5 6.8 14.3 6.7 6.4 13.1
Amounts recognized in the statement of
recognized income and expense in
the year (10.5) (4.1) (14.6) 5.6 15.9 21.5 0.4 4.3 4.7
Employer contributions made in the
year (9.6) (5.7) (15.3) (7.6) (6.5) (14.1) (6.5) (6.6) (13.1)
Benefits paid directly by company
in the year (0.2) (0.8) (1.0) (0.3) (0.8) (1.1) (0.2) - (0.2)
Currency translation effect (3.6) - (3.6) 4.8 - 4.8 (2.4) - (2.4)
Balance sheet liability at December 31 24.1 50.5 74.6 39.5 54.3 93.8 29.5 38.9 68.4
/ ANNUAL REPORT 2006 85