Food Lion 2006 Annual Report Download - page 40
Download and view the complete annual report
Please find page 40 of the 2006 Food Lion annual report below. You can navigate through the pages in the report by either clicking on the pages listed below, or by using the keyword search tool below to find specific information within the annual report.-
 1
1 -
2
-
3
-
4
-
5
-
6
-
7
-
8
-
9
-
10
-
11
-
12
-
13
-
14
-
15
-
16
-
17
-
18
-
19
-
20
-
21
-
22
-
23
-
24
-
25
-
26
-
27
-
28
-
29
-
 30
30 -
 31
31 -
 32
32 -
 33
33 -
 34
34 -
 35
35 -
 36
36 -
 37
37 -
 38
38 -
 39
39 -
 40
40 -
 41
41 -
 42
42 -
 43
43 -
 44
44 -
 45
45 -
 46
46 -
 47
47 -
 48
48 -
 49
49 -
 50
50 -
51
-
52
-
53
-
54
-
55
-
56
-
57
-
58
-
59
-
60
-
61
-
62
-
63
-
64
-
65
-
66
-
67
-
68
-
69
-
70
-
71
-
72
-
73
-
74
-
75
-
76
-
77
-
78
-
79
-
80
-
81
-
82
-
83
-
84
-
85
-
86
-
87
-
88
-
89
-
90
-
91
-
92
-
93
-
94
-
95
-
96
-
97
-
98
-
99
-
100
-
101
-
102
-
103
-
104
-
105
-
106
-
107
-
108
-
109
-
110
-
111
-
112
-
113
-
114
-
115
-
116
 |
 |

DELHAIZE GROUP / ANNUAL REPORT 2006
38
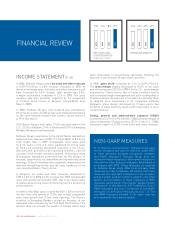
FINANCIAL REVIEW
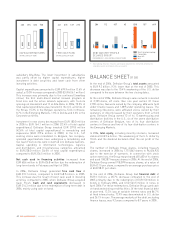
NET SALES AND
OTHER REVENUES
(IN BILLIONS OF EUR)
INCOME STATEMENT (P. 60)
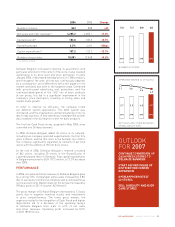
In 2006, Delhaize Group posted net sales and other revenues
of EUR 19.2 billion, a 4.8% increase compared to 2005. At
identical exchange rates, net sales and other revenues would
have increased by 5.5%. Organic sales growth was 5.0%,
a major acceleration compared to 2.1% in 2005. The sales
evolution was also positively impacted by the acquisition
of 43 Cash Fresh stores in Belgium (consolidated from
May 31, 2005).
In 2006, Delhaize Group’s store network was extended by
69 stores for a total of 2,705 at year-end. Detailed information
on the store network evolution per country can be found on
p. 99 of this report.
Of Delhaize Group’s total sales, 71.6% was generated in the
U.S., 22.3% in Belgium, 5.4% in Greece and 0.7% in Emerging
Markets (Romania and Indonesia).
Delhaize Group’s operations in the United States realized net
sales and other revenues of USD 17.3 billion (EUR 13.8 billion),
4.4% higher than in 2005. Comparable store sales grew
by 2.7%. Sales in the U.S. were supported by strong sales
at Food Lion following disciplined execution in the stores,
effective price, promotion and marketing initiatives, and the
success of the market renewal program. Following a weak
fi rst quarter, Hannaford performed well for the balance of
the year, supported by its competitive pricing and many store
openings. Sales at Sweetbay were negatively impacted by the
intensive remodeling activity and the sales weakness at the
non-converted Kash n’ Karry stores.
In Belgium, net sales and other revenues amounted to
EUR 4.3 billion in 2006, a 7.0% increase over 2005. Comparable
store sales growth amounted to 2.8%, due to successful sales
initiatives and a strong focus on improving its price positioning
and perception.
In Greece, Alfa-Beta sales crossed the EUR 1 billion mark for
the fi rst time, with growth of 13.5%, due to high comparable
store sales growth and 13 new store openings. The Group’s
activities in Emerging Markets posted an increase of net
sales and other revenues by 16.1% to EUR 136.9 million. This
amount does not include the results of Delvita, which have
been reclassifi ed to discontinued operations following the
decision to sell Delhaize Group’s Czech activities.
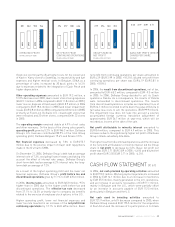
In 2006, gross profi t increased by 4.7% to EUR 4.9 billion.
The gross margin slightly decreased to 25.2% of net sales
and other revenues (25.3% in 2005). In the U.S., gross margin
improved by 7 basis points, due to better inventory results
and continued margin management and price optimization at
Food Lion and an improvement in the sales mix partially offset
by targeted price investments in all companies. Delhaize
Belgium’s gross margin decreased by 13 basis points due
primarily to weak inventory results and investments in price
competitiveness.
Selling, general and administrative expenses (SG&A)
increased by 5.4% to EUR 4.0 billion. SG&A as a percentage of
sales increased by 12 basis points to 20.7%. In the U.S., SG&A
increased slightly to 21.8% of net sales and other revenues.
18.2 17.6 18.3 19.2
2006
2005
2004
2003
OPERATING MARGIN
4.4% 4.9% 4.9% 4.9%
2006
2005
2004
2003
NON-GAAP MEASURES
In its fi nancial communication, Delhaize Group uses
certain measures that have no defi nition under IFRS
or other generally accepted accounting standards
(non-GAAP measures). Delhaize Group does not
represent these measures as alternative measures to
net profi t or other fi nancial measures determined in
accordance with IFRS. These measures as reported
by Delhaize Group might differ from similarly titled
measures by other companies. We believe that these
measures are important indicators for our business
and are widely used by investors, analysts and other
parties. A reconciliation of these measures to IFRS
measures can be found in the chapter “Supplementary
Information” of this report (p. 99). A defi nition of non-
GAAP measures and ratios composed of non-GAAP
measures can be found in the glossary on p. 112. The
non-GAAP measures provided in this report have not
been audited by the statutory auditor.