Food Lion 2006 Annual Report Download - page 35
Download and view the complete annual report
Please find page 35 of the 2006 Food Lion annual report below. You can navigate through the pages in the report by either clicking on the pages listed below, or by using the keyword search tool below to find specific information within the annual report.-
 1
1 -
2
-
3
-
4
-
5
-
6
-
7
-
8
-
9
-
10
-
11
-
12
-
13
-
14
-
15
-
16
-
17
-
18
-
19
-
20
-
21
-
22
-
23
-
24
-
 25
25 -
 26
26 -
 27
27 -
 28
28 -
 29
29 -
 30
30 -
 31
31 -
 32
32 -
 33
33 -
 34
34 -
 35
35 -
 36
36 -
 37
37 -
 38
38 -
 39
39 -
 40
40 -
 41
41 -
 42
42 -
 43
43 -
 44
44 -
 45
45 -
46
-
47
-
48
-
49
-
50
-
51
-
52
-
53
-
54
-
55
-
56
-
57
-
58
-
59
-
60
-
61
-
62
-
63
-
64
-
65
-
66
-
67
-
68
-
69
-
70
-
71
-
72
-
73
-
74
-
75
-
76
-
77
-
78
-
79
-
80
-
81
-
82
-
83
-
84
-
85
-
86
-
87
-
88
-
89
-
90
-
91
-
92
-
93
-
94
-
95
-
96
-
97
-
98
-
99
-
100
-
101
-
102
-
103
-
104
-
105
-
106
-
107
-
108
-
109
-
110
-
111
-
112
-
113
-
114
-
115
-
116
 |
 |
DELHAIZE GROUP / ANNUAL REPORT 2006 33
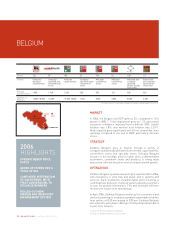
Delhaize Belgium continued to develop its assortment, with
particular attention for the center of the store. It also invested
signifi cantly in its price level and price perception. In early
January 2006, it decreased everyday prices on 1,000 products,
and throughout the year, pricing was continuously adapted.
As a consequence, price differences with price players in the
market narrowed and were in the targeted range. Combined
with price-focused advertising and promotions and the
continued development of the “365” line of basic products
at low prices, this led to a signifi cant improvement in the
company’s price perception, resulting in strong sales and
market share growth.
In order to improve its effi ciency, the company rolled
out different system applications. The ACIS system was
introduced, and the organization started integrating it into its
day-to-day business. A new warehouse management system
was installed in the distribution center for dairy products.
The fi rst two Cash Fresh stores, acquired in May 2005, were
converted into Delhaize banners.
In 2006, Delhaize Belgium added 35 stores to its network,
including two company-operated supermarkets, the fi rst City
store in Ghent, and the fi rst store in the German city of Köln.
The company signifi cantly expanded its network of pet food
stores with the addition of 18 Tom & Co stores.
At the end of 2006, Delhaize Belgium’s network consisted
of 843 stores, including 30 stores in the Grand-Duchy of
Luxembourg and three in Germany. Total capital expenditures
in Belgium amounted to EUR 107.2 million, a 12.3% decrease
over 2005.
PERFORMANCE
In 2006, net sales and other revenues of Delhaize Belgium grew
by a strong 7.0%. Comparable stores sales increased by 2.8%
due to successful commercial initiatives and a continued focus
on price positioning. Market share for the full year increased by
59 basis points to 26.1% (source: AC Nielsen).
The gross margin of Delhaize Belgium decreased by 13 basis
points due to negative inventory results and investments
in price competitiveness. The lower gross margin, the
expenses related to the integration of Cash Fresh and higher
depreciation led to a decrease of the operating margin
of Delhaize Belgium from 4.6% to 4.3% of net sales
and other revenues. Operating profi t increased by 0.5%
to EUR 183.8 million.
OUTLOOK
FOR 2007
CONTINUE CONVERSION OF
CASH FRESH STORES TO
DELHAIZE BANNERS
START SECOND PHASE OF
DISTRIBUTION CENTER
EXPANSION
OPEN APPROXIMATELY
42 STORES
SELL DI BEAUTY AND BODY
CARE STORES
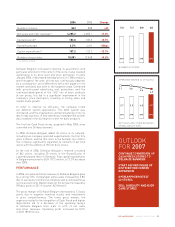
2006 2005 Change
Number of stores 843 808 +35
Net sales and other revenues* 4,285.2 4,005.1 +7.0%
Operating profi t* 183.8 183.0 +0.5%
Operating margin 4.3% 4.6% -28bps
Capital expenditures* 107.2 122.2 -12.3%
Number of associates 18,081 17,968 +0.6%
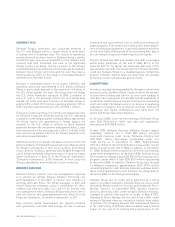
OPERATING MARGIN (% OF SALES)
3.9 4.0 4.3
3.7
2004 20052003 2006
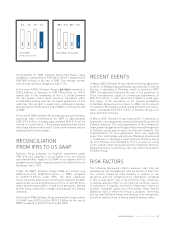
NUMBER OF STORES
747 808 843
2004 2005
728
2003 2006
5.0 4.6 4.3
5.1
* In millions of EUR
NET SALES AND OTHER REVENUES
(IN BILLIONS OF EUR)