Food Lion 2006 Annual Report Download - page 102
Download and view the complete annual report
Please find page 102 of the 2006 Food Lion annual report below. You can navigate through the pages in the report by either clicking on the pages listed below, or by using the keyword search tool below to find specific information within the annual report.-
 1
1 -
2
-
3
-
4
-
5
-
6
-
7
-
8
-
9
-
10
-
11
-
12
-
13
-
14
-
15
-
16
-
17
-
18
-
19
-
20
-
21
-
22
-
23
-
24
-
25
-
26
-
27
-
28
-
29
-
30
-
31
-
32
-
33
-
34
-
35
-
36
-
37
-
38
-
39
-
40
-
41
-
42
-
43
-
44
-
45
-
46
-
47
-
48
-
49
-
50
-
51
-
52
-
53
-
54
-
55
-
56
-
57
-
58
-
59
-
60
-
61
-
62
-
63
-
64
-
65
-
66
-
67
-
68
-
69
-
70
-
71
-
72
-
73
-
74
-
75
-
76
-
77
-
78
-
79
-
80
-
81
-
82
-
83
-
84
-
85
-
86
-
87
-
88
-
89
-
90
-
91
-
 92
92 -
 93
93 -
 94
94 -
 95
95 -
 96
96 -
 97
97 -
 98
98 -
 99
99 -
 100
100 -
 101
101 -
 102
102 -
 103
103 -
 104
104 -
 105
105 -
 106
106 -
 107
107 -
 108
108 -
 109
109 -
 110
110 -
 111
111 -
 112
112 -
113
-
114
-
115
-
116
 |
 |

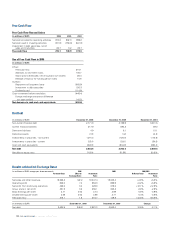
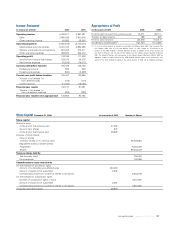
Results at Identical Exchange Rates
(in millions of EUR, except per share amounts) 2006 2005 2006/2005
At Actual Rates Effect of At Identical At Actual Rates At Identical
Exchange Rates Rates Rates
Net sales and other revenues 19,225.2 122.2 19,347.4 18,345.3 +4.8% +5.5%
Operating profit 946.3 7.0 953.3 899.9 +5.2% +5.9%
Net profit from continuing operations 425.6 3.0 428.6 379.6 +12.1% +12.9%
Group share in net profit 351.9 3.2 355.1 365.2 -3.6% -2.8%
Basic earnings per share 3.71 0.03 3.74 3.89 -4.6% -3.8%
Diluted earnings per share 3.55 0.03 3.58 3.71 -4.4% -3.6%
Free cash flow 215.1 1.6 216.7 148.9 +44.5% +45.6%
(in millions of EUR) December 31, 2006 December 31, 2005 Change
Net debt 2,634.5 246.8 2,881.3 2,943.0 -10.5% -2.1%
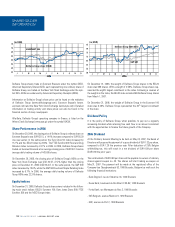
Net Debt
(in millions of EUR) December 31, 2006 December 31, 2005 December 31, 2004
Non-current financial debt 2,771.8 3,199.9 3,331.5
Current financial liabilities 317.9 694.2 69.0
Derivative liabilities 4.9 9.1 15.1
Derivative assets (1.9) (1.2) (6.3)
Investments in securities - non-current (121.0) (125.0) (115.9)
Investments in securities - current (32.4) (29.1) (24.6)
Cash and cash equivalents (304.8) (804.9) (660.4)
Net debt 2,634.5 2,943.0 2,608.4
Net debt to equity ratio 74.0% 81.8% 90.6%
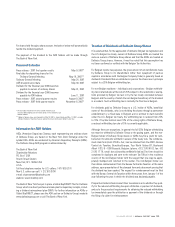
Free Cash Flow
Free Cash Flow Reconciliation
(in millions of EUR) 2006 2005 2004
Net cash provided by operating activities 910.3 902.3 989.2
Net cash used in investing activities (721.9) (756.6) (641.9)
Investment in debt securities, net of
sales and maturities 26.7 3.2 25.7
Free cash flow 215.1 148.9 373.0
Use of Free Cash Flow in 2006
(in millions of EUR)
Inflow:
Free cash flow 215.1
Additions to short-term loans 106.7
Stock options exercised, net of buyback own shares 26.4
Release of escrow for funding senior notes 10.8
Outflow:
Repayment of long-term loans (665.9)
Investment in debt securities (26.7)
Dividends paid (114.8)
Cash movement before translation (448.4)
Foreign exchange translation difference
(on cash portion) (42.2)
Net decrease in cash and cash equivalents (490.6)
/ ANNUAL REPORT 2006
100