Food Lion 2006 Annual Report Download - page 73
Download and view the complete annual report
Please find page 73 of the 2006 Food Lion annual report below. You can navigate through the pages in the report by either clicking on the pages listed below, or by using the keyword search tool below to find specific information within the annual report.-
 1
1 -
2
-
3
-
4
-
5
-
6
-
7
-
8
-
9
-
10
-
11
-
12
-
13
-
14
-
15
-
16
-
17
-
18
-
19
-
20
-
21
-
22
-
23
-
24
-
25
-
26
-
27
-
28
-
29
-
30
-
31
-
32
-
33
-
34
-
35
-
36
-
37
-
38
-
39
-
40
-
41
-
42
-
43
-
44
-
45
-
46
-
47
-
48
-
49
-
50
-
51
-
52
-
53
-
54
-
55
-
56
-
57
-
58
-
59
-
60
-
61
-
62
-
 63
63 -
 64
64 -
 65
65 -
 66
66 -
 67
67 -
 68
68 -
 69
69 -
 70
70 -
 71
71 -
 72
72 -
 73
73 -
 74
74 -
 75
75 -
 76
76 -
 77
77 -
 78
78 -
 79
79 -
 80
80 -
 81
81 -
 82
82 -
 83
83 -
84
-
85
-
86
-
87
-
88
-
89
-
90
-
91
-
92
-
93
-
94
-
95
-
96
-
97
-
98
-
99
-
100
-
101
-
102
-
103
-
104
-
105
-
106
-
107
-
108
-
109
-
110
-
111
-
112
-
113
-
114
-
115
-
116
 |
 |

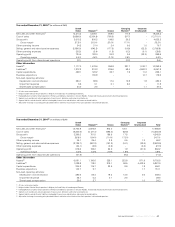
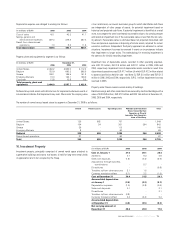
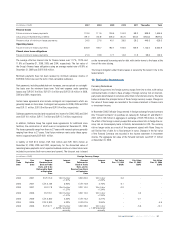
Trade name assets are allocated as follows:
(in millions of EUR) December 31,
2006 2005 2004
Food Lion 196.2 219.0 189.7
Hannaford 164.0 183.1 158.5
United States 360.2 402.1 348.2
Amortization expense was charged to earnings as follows:
(in millions of EUR) 2006 2005 2004
Selling, general and
administrative expenses 52.6 51.3 47.5
Result from discontinued
operations 0.2 0.5 0.5
Total amortization expense 52.8 51.8 48.0
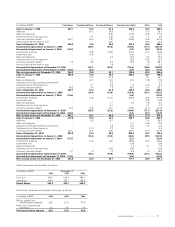
(in millions of EUR)
Trade Names Developed Software Purchased Software Favorable Lease Rights Other Total
Cost at January 1, 2006 442.1 57.2 81.8 322.2 45.2 948.5
Additions - 20.7 26.0 1.1 4.3 52.1
Sales and disposals - - (0.6) (16.2) (0.2) (17.0)
Transfers to/from other accounts - 2.1 (0.5) (1.9) 1.1 0.8
Currency translation effect (46.1) (5.4) (7.8) (32.8) (4.9) (97.0)
Amount classified as held for sale - - (2.5) - (0.5) (3.0)
Cost at December 31, 2006 396.0 74.6 96.4 272.4 45.0 884.4
Accumulated depreciation at January 1, 2006 - (28.5) (33.2) (149.0) (17.1) (227.8)
Accumulated impairment at January 1, 2006 (40.0) - - (5.3) (0.2) (45.5)
Amortization expense - (8.8) (15.9) (24.4) (3.7) (52.8)
Impairment loss - (0.5) - (0.2) - (0.7)
Sales and disposals - - 0.4 16.2 0.2 16.8
Transfers to/from other accounts - 0.1 - (0.6) (0.2) (0.7)
Currency translation effect 4.2 2.6 3.5 16.5 1.9 28.7
Amount classified as held for sale - - 1.9 - 0.3 2.2
Accumulated depreciation at December 31, 2006 - (34.7) (43.3) (141.4) (18.6) (238.0)
Accumulated impairment at December 31, 2006 (35.8) (0.4) - (5.4) (0.2) (41.8)
Net carrying amount at December 31, 2006 360.2 39.5 53.1 125.6 26.2 604.6
Cost at January 1, 2005 382.8 41.6 49.3 282.2 40.7 796.6
Additions - 10.2 21.8 - 2.1 34.1
Sales and disposals - (0.1) (1.0) (4.7) (1.8) (7.6)
Acquisitions through business combinations - - 0.4 - - 0.4
Transfers to/from other accounts - 0.1 3.5 1.2 (1.9) 2.9
Currency translation effect 59.3 5.4 7.8 43.5 6.1 122.1
Cost at December 31, 2005 442.1
57.2 81.8 322.2 45.2 948.5
Accumulated depreciation at January 1, 2005 - (18.4) (19.6) (105.9) (12.1) (156.0)
Accumulated impairment at January 1, 2005 (34.6) - - (4.6) - (39.2)
Amortization expense - (7.9) (10.7) (29.3) (3.9) (51.8)
Impairment loss - - - - (0.2) (0.2)
Sales and disposals - - 0.1 4.0 0.9 5.0
Transfers to/from other accounts - - 0.1 - 0.1 0.2
Currency translation effect (5.4) (2.2) (3.1) (18.5) (2.1) (31.3)
Accumulated depreciation at December 31, 2005 - (28.5) (33.2) (149.0) (17.1) (227.8)
Accumulated impairment at December 31, 2005 (40.0) - - (5.3) (0.2) (45.5)
Net carrying amount at December 31, 2005 402.1 28.7 48.6 167.9 27.9 675.2
Cost at January 1, 2004 412.9 37.9 33.5 308.1 40.6 833.0
Additions - 6.5 15.1 - 3.6 25.2
Sales and disposals - - - (1.7) (0.5) (2.2)
Acquisitions through business combinations - - 0.9 (2.7) 0.1 (1.7)
Transfers to/from other accounts - (0.1) 3.3 0.6 - 3.8
Currency translation effect (30.1) (2.7) (3.5) (22.1) (3.1) (61.5)
Cost at December 31, 2004 382.8 41.6 49.3 282.2 40.7 796.6
Accumulated depreciation at January 1, 2004 - (12.4) (13.5) (86.0) (8.9) (120.8)
Accumulated impairment at January 1, 2004 (37.3) - - (2.1) - (39.4)
Amortization expense - (7.0) (7.2) (29.5) (4.3) (48.0)
Impairment loss - - - (2.9) - (2.9)
Sales and disposals - - - 1.4 0.1 1.5
Transfers to/from other accounts - - (0.2) (0.6) - (0.8)
Currency translation effect 2.7 1.0 1.3 9.2 1.0 15.2
Accumulated depreciation at December 31, 2004 - (18.4) (19.6) (105.9) (12.1) (156.0)
Accumulated impairment at December 31, 2004 (34.6) - - (4.6) - (39.2)
Net carrying amount at December 31, 2004 348.2 23.2 29.7 171.7 28.6 601.4
/ ANNUAL REPORT 2006 71