Food Lion 2006 Annual Report Download - page 113
Download and view the complete annual report
Please find page 113 of the 2006 Food Lion annual report below. You can navigate through the pages in the report by either clicking on the pages listed below, or by using the keyword search tool below to find specific information within the annual report.-
 1
1 -
2
-
3
-
4
-
5
-
6
-
7
-
8
-
9
-
10
-
11
-
12
-
13
-
14
-
15
-
16
-
17
-
18
-
19
-
20
-
21
-
22
-
23
-
24
-
25
-
26
-
27
-
28
-
29
-
30
-
31
-
32
-
33
-
34
-
35
-
36
-
37
-
38
-
39
-
40
-
41
-
42
-
43
-
44
-
45
-
46
-
47
-
48
-
49
-
50
-
51
-
52
-
53
-
54
-
55
-
56
-
57
-
58
-
59
-
60
-
61
-
62
-
63
-
64
-
65
-
66
-
67
-
68
-
69
-
70
-
71
-
72
-
73
-
74
-
75
-
76
-
77
-
78
-
79
-
80
-
81
-
82
-
83
-
84
-
85
-
86
-
87
-
88
-
89
-
90
-
91
-
92
-
93
-
94
-
95
-
96
-
97
-
98
-
99
-
100
-
101
-
102
-
 103
103 -
 104
104 -
 105
105 -
 106
106 -
 107
107 -
 108
108 -
 109
109 -
 110
110 -
 111
111 -
 112
112 -
 113
113 -
 114
114 -
 115
115 -
 116
116
 |
 |

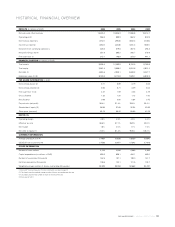
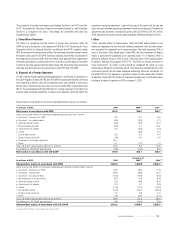
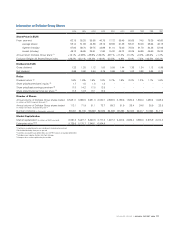
Information on Delhaize Group Shares
2006 2005 2004 2003 2002 2001 2000 1999 1998 1997
Share Price (in EUR)
Price: year-end 63.15 55.20 55.95 40.78 17.72 58.45 50.65 74.8 75.36 46.60
average (close) 58.14 51.68 44.98 28.15 39.93 61.28 59.27 80.00 65.64 46.18
highest (intraday) 67.00 59.70 59.75 43.99 61.10 72.00 76.50 91.70 84.28 52.06
lowest (intraday) 49.12 45.95 36.61 11.90 15.00 48.72 48.05 64.90 46.60 35.20
Annual return Delhaize Group share
(1)
+16.1% +0.69% +39.9%+136.3% -69.1% +17.2% -31.3% +3.0% +63.6% +1.3%
Evolution Belgian All Shares Return index +26.2% +28.1% +38.2% +16.0% -22.5% -4.9% -5.0% -7.2% +43.5% +36.2%
Dividend (in EUR)
Gross dividend 1.32 1.20 1.12 1.00 0.88 1.44 1.36 1.24 1.12 0.99
Net dividend 0.99 0.90 0.84 0.75 0.66 1.08 1.02 0.93 0.84 0.74
Ratios
Dividend return
(2)
1.6% 1.6% 1.5% 1.8% 3.7% 1.9% 2.0% 1.2% 1.1% 1.6%
Share price/shareholders’ equity
(3)
1.7 1.5 1.8 1.4 - - - - - -
Share price/basic earnings per share
(3)
17.0 14.2 17.5 13.5 - - - - - -
Share price/diluted earnings per share
(3)
17.8 14.9 18.1 13.5 - - - - - -
Number of Shares
Annual volume of Delhaize Group shares traded
(in millions of EUR; Euronext Brussels)
(4)
6,548.11 3,685.5 3,581.0 2,020.7 2,568.5 3,198.6 1,520.6 1,930.4 1,688.2 1,048.6
Annual volume of Delhaize Group shares traded
(in millions of shares; Euronext Brussel)
(4)
113.1 71.9 81.1 72.7 69.3 51.9 26.4 24.6 25.9 22.8
Number of shares
(in thousands; year-end)
96,457 94,705 93,669 92,625 92,393 92,393 52,032 52,017 51,963 51,717
Market Capitalization
Market capitalization
(in millions of EUR; year-end)
6,091.3 5,227.7 5,240.8 3,777.2 1,637.2 5,400.4 2,635.4 3,890.0 3,915.9 2,410.2
Enterprise value
(3) (5)
8,725.8 8,170.7 7,849.1 6,804.9 - - - - - -
(1) Capital gains recorded during the year, including net dividend and reinvestment.
(2) Net dividend divided by share price at year-end.
(3) Cannot be calculated for years before 2003, since no IFRS financials are available before 2003.
(4) Excluding shares traded on the New York Stock Exchange.
(5) Entreprise value = market capitalization plus net debt.
DELHAIZE GROUP / ANNUAL REPORT 2006 111