Food Lion 2006 Annual Report Download - page 64
Download and view the complete annual report
Please find page 64 of the 2006 Food Lion annual report below. You can navigate through the pages in the report by either clicking on the pages listed below, or by using the keyword search tool below to find specific information within the annual report.-
 1
1 -
2
-
3
-
4
-
5
-
6
-
7
-
8
-
9
-
10
-
11
-
12
-
13
-
14
-
15
-
16
-
17
-
18
-
19
-
20
-
21
-
22
-
23
-
24
-
25
-
26
-
27
-
28
-
29
-
30
-
31
-
32
-
33
-
34
-
35
-
36
-
37
-
38
-
39
-
40
-
41
-
42
-
43
-
44
-
45
-
46
-
47
-
48
-
49
-
50
-
51
-
52
-
53
-
 54
54 -
 55
55 -
 56
56 -
 57
57 -
 58
58 -
 59
59 -
 60
60 -
 61
61 -
 62
62 -
 63
63 -
 64
64 -
 65
65 -
 66
66 -
 67
67 -
 68
68 -
 69
69 -
 70
70 -
 71
71 -
 72
72 -
 73
73 -
 74
74 -
75
-
76
-
77
-
78
-
79
-
80
-
81
-
82
-
83
-
84
-
85
-
86
-
87
-
88
-
89
-
90
-
91
-
92
-
93
-
94
-
95
-
96
-
97
-
98
-
99
-
100
-
101
-
102
-
103
-
104
-
105
-
106
-
107
-
108
-
109
-
110
-
111
-
112
-
113
-
114
-
115
-
116
 |
 |

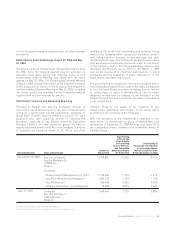
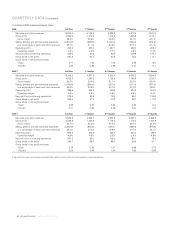
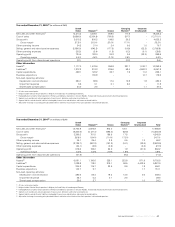
(Unaudited)
(in millions of EUR, except earnings per share)
2006 Full Year 1
st
Quarter 2
nd
Quarter 3
rd
Quarter 4
th
Quarter
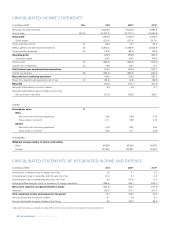
Net sales and other revenues 19,225.2 4,735.5 4,829.8 4,812.6 4,847.3
Gross profit 4,853.0 1,212.9 1,218.2 1,205.8 1,216.1
Gross margin 25.2% 25.6% 25.2% 25.1% 25.1%
Selling, general and administrative expenses (3,970.3) (999.5) (1,002.0) (994.3) (974.5)
as a percentage of sales and other revenues 20.7% 21.1% 20.8% 20.7% 20.1%
Operating profit 946.3 227.4 227.1 229.4 262.4
Operating margin 4.9% 4.8% 4.7% 4.8% 5.4%
Net profit from continuing operations 425.6 97.8 96.9 108.8 122.1
Group share in net profit 351.9 97.3 94.6 45.3 114.7
Group share in net profit per share:
- Basic 3.71 1.03 1.00 0.48 1.20
- Diluted 3.55 0.99 0.96 0.47 1.14
2005
(1)
Full Year 1
st
Quarter 2
nd
Quarter 3
rd
Quarter 4
th
Quarter
Net sales and other revenues 18,345.3 4,247.8 4,520.4 4,682.2 4.894.9
Gross profit 4,635.2 1,080.5 1,135.2 1,186.8 1,232.7
Gross margin 25.3% 25.4% 25.1% 25.3% 25.2%
Selling, general and administrative expenses (3,766.8) (886.6) (937.6) (971.0) (971.6)
as a percentage of sales and other revenues 20.5% 20.9% 20.7% 20.7% 19.9%
Operating profit 899.9 205.3 205.8 224.2 264.2
Operating margin 4.9% 4.8% 4.6% 4.8% 5.4%
Net profit from continuing operations 379.6 84.8 78.0 92.0 124.8
Group share in net profit 365.2 81.3 76.9 89.7 117.3
Group share in net profit per share:
- Basic 3.89 0.87 0.82 0.95 1.24
- Diluted 3.71 0.83 0.79 0.91 1.18
2004
(1)
Full Year 1
st
Quarter 2
nd
Quarter 3
rd
Quarter 4
th
Quarter
Net sales and other revenues 17,596.8 4,259.7 4,523.5 4,453.7 4,359.9
Gross profit 4,345.9 1,042.5 1,119.2 1,116.4 1,067.8
Gross margin 24.7% 24.5% 24.7% 25.1% 24.5%
Selling, general and administrative expenses (3,522.9) (850.3) (900.1) (896.6) (875.9)
as a percentage of sales and other revenues 20.0% 20.0% 19.9% 20.1% 20.1%
Operating profit 862.2 202.9 236.5 223.4 199.4
Operating margin 4.9% 4.8% 5.2% 5.0% 4.6%
Net profit from continuing operations 357.3 82.6 105.0 93.1 76.6
Group share in net profit 295.7 39.2 99.0 90.4 67.1
Group share in net profit per share:
- Basic 3.19 0.42 1.07 0.98 0.72
- Diluted 3.09 0.42 1.04 0.93 0.69
(1) Adjusted for the change in accounting policy described in Note 3 and for the reclassification of the Czech operations in discontinued operations
/ ANNUAL REPORT 2006
62