Food Lion 2006 Annual Report Download - page 3
Download and view the complete annual report
Please find page 3 of the 2006 Food Lion annual report below. You can navigate through the pages in the report by either clicking on the pages listed below, or by using the keyword search tool below to find specific information within the annual report.-
 1
1 -
 2
2 -
 3
3 -
 4
4 -
 5
5 -
 6
6 -
 7
7 -
 8
8 -
 9
9 -
 10
10 -
 11
11 -
 12
12 -
 13
13 -
 14
14 -
15
-
16
-
17
-
18
-
19
-
20
-
21
-
22
-
23
-
24
-
25
-
26
-
27
-
28
-
29
-
30
-
31
-
32
-
33
-
34
-
35
-
36
-
37
-
38
-
39
-
40
-
41
-
42
-
43
-
44
-
45
-
46
-
47
-
48
-
49
-
50
-
51
-
52
-
53
-
54
-
55
-
56
-
57
-
58
-
59
-
60
-
61
-
62
-
63
-
64
-
65
-
66
-
67
-
68
-
69
-
70
-
71
-
72
-
73
-
74
-
75
-
76
-
77
-
78
-
79
-
80
-
81
-
82
-
83
-
84
-
85
-
86
-
87
-
88
-
89
-
90
-
91
-
92
-
93
-
94
-
95
-
96
-
97
-
98
-
99
-
100
-
101
-
102
-
103
-
104
-
105
-
106
-
107
-
108
-
109
-
110
-
111
-
112
-
113
-
114
-
115
-
116
 |
 |
DELHAIZE GROUP / ANNUAL REPORT 2006 1
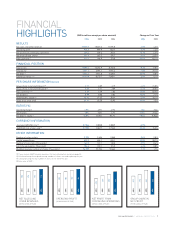
FINANCIAL
HIGHLIGHTS Change vs Prior Year (EUR in millions except per share amounts)
2006 2005 2004 2006 2005
RESULTS
Net sales and other revenues 19,225.2 18,345.3 17,596.8 4.8% 4.3%
Operating profit 946.3 899.9 862.2 5.2% 4.4%
Net profit from continuing operations 425.6 379.6 357.3 12.1% 6.2%
Net profit (Group share) 351.9 365.2 295.7 -3.6% 23.5%
Free cash flow
(1)
215.1 148.9 373.0 44.5% -60.1%
FINANCIAL POSITION
Total assets 9,295.4 10,253.9 8,702.5 -9.3% 17.8%
Total equity 3,561.4 3,596.1 2,874.6 -1.0% 25.1%
Net debt
(1)
2,634.6 2,943.0 2,608.3 -10.5% 12.8%
Enterprise value
(1) (3)
8,725.8 8,170.7 7,849.1 6.8% 4.1%
PER SHARE INFORMATION
(IN EUR)
Group share in net profit (basic)
(2)
3.71 3.89 3.19 -4.6% 21.8%
Group share in net profit (diluted)
(2)
3.55 3.71 3.09 -4.4% 20.0%
Free cash flow
(1)(2)
2.27 1.59 4.03 42.8% -60.5%
Net dividend 0.99 0.90 0.84 10.0% 7.1%
Shareholders’ equity
(3)
36.55 37.65 30.34 -2.9% 24.1%
Share price (year-end) 63.15 55.20 55.95 14.4% -1.3%
RATIOS (%)
Operating margin 4.9% 4.9% 4.9% 1bps 3bps
Net margin 1.8% 2.0% 1.7% -16bps 31bps
Net debt to equity
(1)
74.0% 81.8% 90.7% -7.8ppt -8.9ppt
CURRENCY INFORMATION
Average EUR/USD rate
(4)
0.7964 0.8038 0.8039 -0.9% -
EUR/USD rate at year-end
(4)
0.7593 0.8477 0.7342 -10.4% 15.5%
OTHER INFORMATION
Number of sales outlets 2,705 2,636 2,565 2.6% 2.8%
Capital expenditures 699.9 636.1 494.1 10.0% 28.7%
Number of associates (thousands) 142.5 137.1 138.0 3.9% -0.6%
Full-time equivalents (thousands) 106.6 102.1 101.5 4.4% 0.8%
Weighted average number of shares (thousands) 94,939 93,934 92,663 1.1% 1.7%
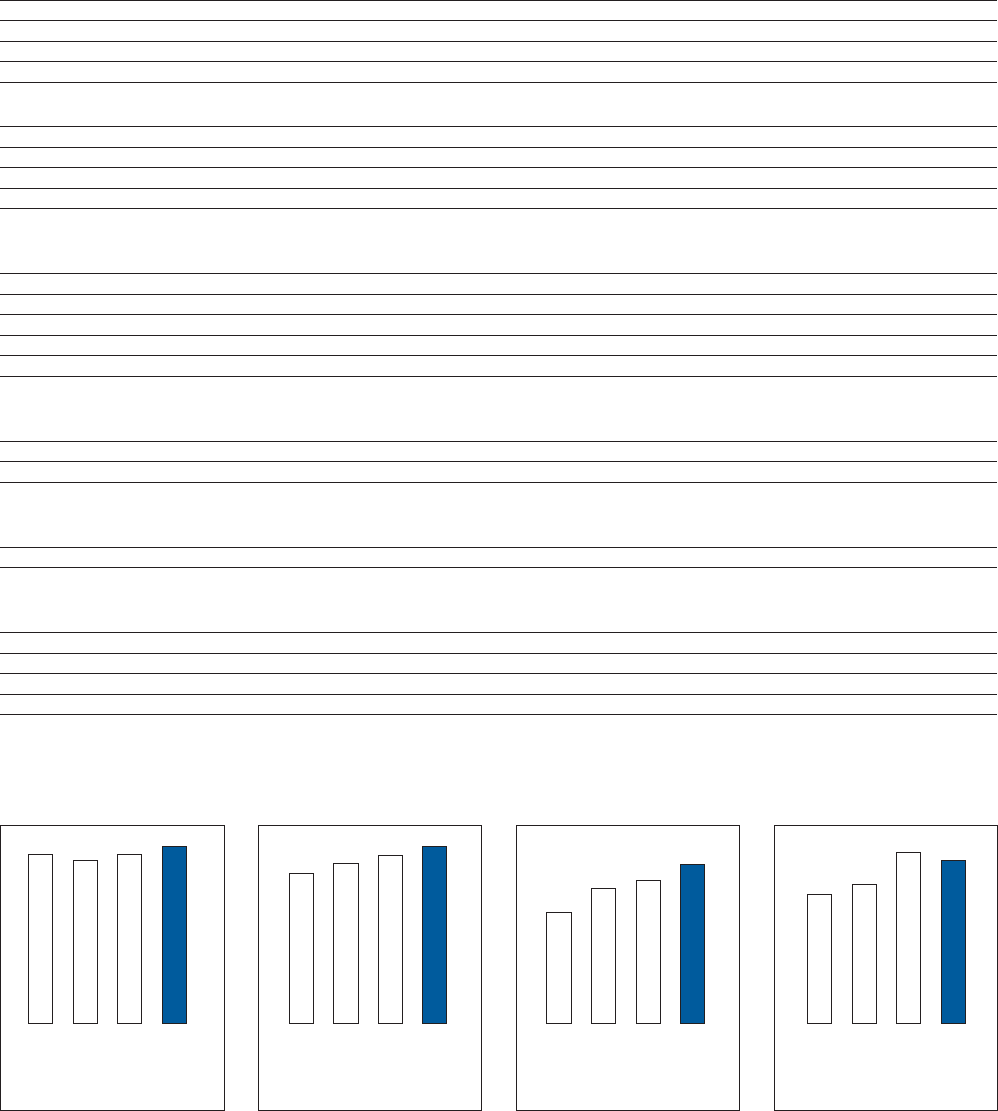
NET SALES AND
OTHER REVENUES
(IN BILLIONS OF EUR)
2004
2005
2003
OPERATING PROFIT
(IN MILLIONS OF EUR)
2004
2005
2003
NET PROFIT FROM
CONTINUING OPERATIONS
(IN MILLIONS OF EUR)
2004
2005
2003
GROUP SHARE IN
NET PROFIT
(IN MILLIONS OF EUR)
2004
2005
2003
2006
(1) These are non-GAAP fi nancial measures. For more information, see box on page 38.
(2) Calculated using the weighted average number of shares outstanding during the year.
(3) Calculated using the total number of shares at the end of the year.
(4) Euro value of USD 1.
18.2
17.6
18.3
19.2
801
862
900
946
294
357
380
426
279
296
365
352
2006
2006
2006