Food Lion 2006 Annual Report Download - page 74
Download and view the complete annual report
Please find page 74 of the 2006 Food Lion annual report below. You can navigate through the pages in the report by either clicking on the pages listed below, or by using the keyword search tool below to find specific information within the annual report.-
 1
1 -
2
-
3
-
4
-
5
-
6
-
7
-
8
-
9
-
10
-
11
-
12
-
13
-
14
-
15
-
16
-
17
-
18
-
19
-
20
-
21
-
22
-
23
-
24
-
25
-
26
-
27
-
28
-
29
-
30
-
31
-
32
-
33
-
34
-
35
-
36
-
37
-
38
-
39
-
40
-
41
-
42
-
43
-
44
-
45
-
46
-
47
-
48
-
49
-
50
-
51
-
52
-
53
-
54
-
55
-
56
-
57
-
58
-
59
-
60
-
61
-
62
-
63
-
 64
64 -
 65
65 -
 66
66 -
 67
67 -
 68
68 -
 69
69 -
 70
70 -
 71
71 -
 72
72 -
 73
73 -
 74
74 -
 75
75 -
 76
76 -
 77
77 -
 78
78 -
 79
79 -
 80
80 -
 81
81 -
 82
82 -
 83
83 -
 84
84 -
85
-
86
-
87
-
88
-
89
-
90
-
91
-
92
-
93
-
94
-
95
-
96
-
97
-
98
-
99
-
100
-
101
-
102
-
103
-
104
-
105
-
106
-
107
-
108
-
109
-
110
-
111
-
112
-
113
-
114
-
115
-
116
 |
 |

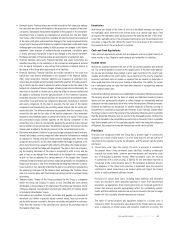
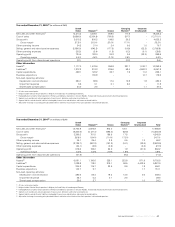
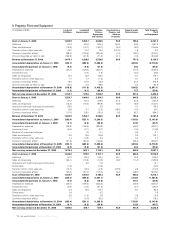
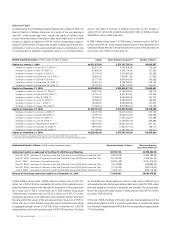
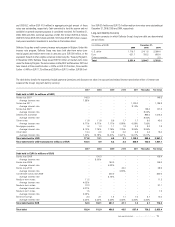
9. Property, Plant and Equipment
(in millions of EUR)
Land and Leasehold Furniture, Construction in Property under Total Property,
Buildings Improvements Fixtures, Progress and Finance Leases Plant
Equipment Advance and Equipment
and Vehicles Payments
Cost at January 1, 2006 1,605.9 1,252.7 2,636.5 80.9 785.4 6,361.4
Additions 57.2 124.8 304.4 150.4 54.5 691.3
Sales and disposals (16.5) (12.7) (156.7) (2.4) (6.6) (194.9)
Transfer to/from other accounts 42.7 70.0 16.4 (127.6) 1.8 3.3
Currency translation effect (88.4) (103.4) (204.5) (7.4) (76.0) (479.7)
Amount classified as held for sale (126.8) (41.8) (71.3) (3.1) (1.9) (244.9)
Balance at December 31, 2006 1,474.1 1,289.6 2,524.8 90.8 757.2 6,136.5
Accumulated depreciation at January 1, 2006 (323.1) (680.2) (1,486.4) - (228.8) (2,718.5)
Accumulated Impairment at January 1, 2006 (6.4) (9.4) (31.0) - (8.4) (55.2)
Depreciation expense (47.0) (109.0) (246.1) - (47.3) (449.4)
Impairment loss - (0.7) (1.5) - (0.4) (2.6)
Sales and disposals 10.4 12.2 149.0 - 5.1 176.7
Transfers to/from other accounts 1.7 1.7 (1.0) - 0.1 2.5
Currency translation effect 18.0 57.5 113.9 - 23.4 212.8
Amount classified as held for sale 26.4 11.9 58.5 - 0.4 97.2
Accumulated depreciation at December 31, 2006 (318.8) (711.9) (1,418.2) - (248.2) (2,697.1)
Accumulated impairment at December 31, 2006 (1.2) (4.1) (26.4) - (7.7) (39.4)
Net carrying amount at December 31, 2006 1,154.1 573.6 1,080.2 90.8 501.3 3,400.0
Cost at January 1, 2005 1,350.7 1,004.0 2,164.3 46.9 646.2 5,212.1
Additions 91.2 137.4 318.5 47.3 53.5 647.9
Sales and disposals (12.4) (15.4) (98.8) (0.9) (5.6) (133.1)
Acquisitions through business combinations 38.3 - 3.9 - 0.1 42.3
Transfers to/from other accounts 16.6 4.7 (3.3) (18.6) (1.5) (2.1)
Currency translation effect 121.5 122.0 251.9 6.2 92.7 594.3
Balance at December 31, 2005 1,605.9 1,252.7 2,636.5 80.9 785.4 6,361.4
Accumulated depreciation at January 1, 2005 (263.4) (521.1) (1,200.3) - (158.8) (2,143.6)
Accumulated impairment at January 1, 2005 (0.7) (6.2) (24.9) - (13.9) (45.7)
Depreciation expense (39.9) (106.0) (238.2) - (46.6) (430.7)
Impairment loss (5.6) (3.1) (2.7) - (1.5) (12.9)
Reversal of impairment charges - 1.5 0.1 - 0.5 2.1
Sales and disposals 0.5 13.5 84.6 - 3.5 102.1
Transfers to/from other accounts 1.4 (3.2) 4.5 - 5.0 7.7
Currency translation effect (21.8) (65.0) (140.5) - (25.4) (252.7)
Accumulated depreciation at December 31, 2005 (323.1) (680.2) (1,486.4) - (228.8) (2,718.5)
Accumulated impairment at December 31, 2005 (6.4) (9.4) (31.0) - (8.4) (55.2)
Net carrying amount at December 31, 2005 1,276.4 563.1 1,119.1 80.9 548.2 3,587.7
Cost at January 1, 2004 1,346.0 970.0 2,101.1 32.5 626.6 5,076.2
Additions 91.3 83.4 247.4 45.1 76.2 543.4
Sales and disposals (24.1) (18.3) (74.0) (0.6) (11.4) (128.4)
Acquisitions through business combinations - 2.6 11.5 - - 14.1
Divestitures (1.5) - (0.5) - - (2.0)
Transfer to/from other accounts (10.7) 23.3 (2.5) (27.9) 2.8 (15.0)
Currency translation effect (50.3) (57.0) (118.7) (2.2) (48.0) (276.2)
Cost at December 31, 2004 1,350.7 1,004.0 2,164.3 46.9 646.2 5,212.1
Accumulated depreciation at January 1, 2004 (235.4) (456.8) (1,097.1) - (134.3) (1,923.6)
Accumulated Impairment at January 1, 2004 (3.0) (6.8) (10.5) - (15.1) (35.4)
Depreciation expense (35.0) (105.4) (233.4) - (46.9) (420.7)
Impairment loss (0.6) (4.4) (21.0) - (0.7) (26.7)
Sales and disposals 0.3 15.5 66.7 - 9.7 92.2
Divestitures 1.6 - 0.3 - - 1.9
Transfers to/from other accounts 6.9 (1.2) 3.8 - 0.9 10.4
Currency translation effect 1.1 31.8 66.0 - 13.7 112.6
Accumulated depreciation at December 31, 2004 (263.4) (521.1) (1,200.3) - (158.8) (2,143.6)
Accumulated impairment at December 31, 2004 (0.7) (6.2) (24.9) - (13.9) (45.7)
Net carrying amount at December 31, 2004 1,086.6 476.7 939.1 46.9 473.5 3,022.8
/ ANNUAL REPORT 2006
72