Food Lion 2006 Annual Report Download - page 70
Download and view the complete annual report
Please find page 70 of the 2006 Food Lion annual report below. You can navigate through the pages in the report by either clicking on the pages listed below, or by using the keyword search tool below to find specific information within the annual report.-
 1
1 -
2
-
3
-
4
-
5
-
6
-
7
-
8
-
9
-
10
-
11
-
12
-
13
-
14
-
15
-
16
-
17
-
18
-
19
-
20
-
21
-
22
-
23
-
24
-
25
-
26
-
27
-
28
-
29
-
30
-
31
-
32
-
33
-
34
-
35
-
36
-
37
-
38
-
39
-
40
-
41
-
42
-
43
-
44
-
45
-
46
-
47
-
48
-
49
-
50
-
51
-
52
-
53
-
54
-
55
-
56
-
57
-
58
-
59
-
 60
60 -
 61
61 -
 62
62 -
 63
63 -
 64
64 -
 65
65 -
 66
66 -
 67
67 -
 68
68 -
 69
69 -
 70
70 -
 71
71 -
 72
72 -
 73
73 -
 74
74 -
 75
75 -
 76
76 -
 77
77 -
 78
78 -
 79
79 -
 80
80 -
81
-
82
-
83
-
84
-
85
-
86
-
87
-
88
-
89
-
90
-
91
-
92
-
93
-
94
-
95
-
96
-
97
-
98
-
99
-
100
-
101
-
102
-
103
-
104
-
105
-
106
-
107
-
108
-
109
-
110
-
111
-
112
-
113
-
114
-
115
-
116
 |
 |

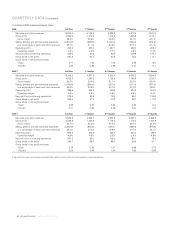
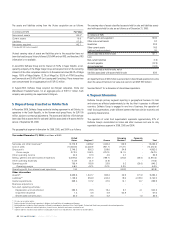
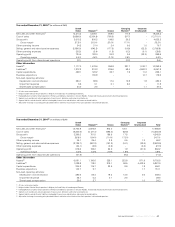
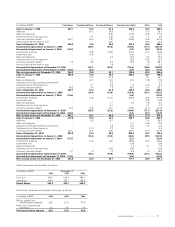
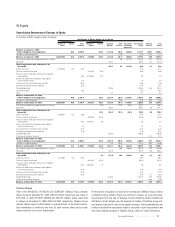
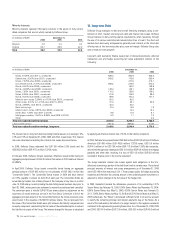
The geographical segment information for 2006, 2005, and 2004 is as follows:
Year ended December 31, 2006
(in millions of EUR)
United Emerging Corporate
States Belgium
(2)
Greece Markets
(3)
(Unallocated) Total
Net sales and other revenues
(1)
13,772.8 4,285.2 1,030.3 136.9 - 19,225.2
Cost of sales (10,023.5) (3,434.9) (801.7) (112.1) - (14,372.2)
Gross profit 3,749.3 850.3 228.6 24.8 - 4,853.0
Gross margin 27.2% 19.8% 22.2% 18.1% - 25.2%
Other operating income 40.3 37.3 4.5 0.7 - 82.8
Selling, general and administrative expenses (3,009.3) (700.1) (199.7) (25.2) (36.0) (3,970.3)
Other operating expenses (14.9) (3.7) (0.6) - - (19.2)
Operating profit 765.4 183.8 32.8 0.3 (36.0) 946.3
Operating margin 5.6% 4.3% 3.2% 0.2% - 4.9%
Operating profit from discontinued operations (1.6) - - (62.2) - (63.8)
Other information
Assets
(4)
6,659.6 1,547.7 383.3 32.9 671.9 9,295.4
Liabilities
(5)
1,139.2 253.9 243.3 18.6 4,079.0 5,734.0
Capital expenditures 528.4 107.2 37.5 12.1 14.7 699.9
Business acquisitions - - - - - -
Non-cash operating activities:
Depreciation and amortization 393.5 76.5 19.4 9.7 4.1 503.2
Impairment expense 1.4 0.5 0.9 64.8 - 67.6
Share-based compensation 20.0 2.3 0.2 - 1.0 23.5
(1)
All sales are to external parties.
(2)
Belgium includes Delhaize Group’s operations in Belgium, the Grand-Duchy of Luxembourg and Germany.
(3)
Emerging Markets include the Group’s operations in Romania and Indonesia. Operations in the Czech Republic, Thailand and Slovakia are presented in discontinued operations.
(4)
Segment assets exclude cash and cash equivalents, financial assets, derivatives and income tax related assets.
(5)
Segment liabilities exclude financial liabilities including debt, finance leases and derivatives and income tax related liabilities.
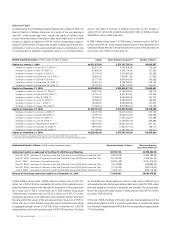
The assets and liabilities arising from the Victory acquisition are as follows:
(in millions of EUR)
Fair Value
Non-current assets 144.0*
Current assets 16.9
Liabilities (17.2)
Net assets acquired 143.7
(*) Including EUR 130.4 million in goodwill
Victory’s carrying value of assets and liabilities prior to the acquisition have not
been disclosed because Victory followed US GAAP and not IFRS, and therefore, IFRS
information is not available.
In June 2004, Delhaize Group sold its interest of 70.0% in Super Dolphin, a non-
operating company of the Mega Image Group and acquired most of the remaining
interests of the other companies related to its Romanian activities (30.0% of Mega
Image, 18.6% of Mega Dolphin, 13.2% of Mega Doi, 30.0% of ATTM Consulting
and Commercial and 30.0% of NP Lion Leasing and Consulting). These transactions
were consummated for an aggregate price of EUR 0.3 million.
In August 2004, Delhaize Group acquired two Belgian companies, Distra and
Warenhuizen Troukens-Peeters, for an aggregate price of EUR 5.7 million. Each
company was operating one supermarket in Belgium.
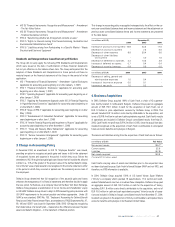
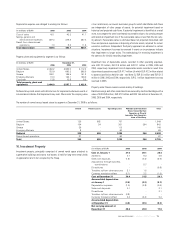
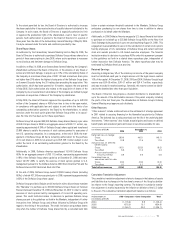
5. Disposal Group Classified as Held for Sale
In November 2006, Delhaize Group reached a binding agreement to sell Delvita, its
operations in the Czech Republic, to the German retail group Rewe, for EUR 100
million, subject to contractual adjustments. The assets and liabilities of Delvita have
been classified as assets held for sale and liabilities associated with assets held for
sale as of September 30, 2006.
The carrying value of assets classified as assets held for sale and liabilities associ-
ated with assets held for sale are as follows as of December 31, 2006:
(in millions of EUR)
Property, plant and equipment 100.5
Other non-current assets 3.2
Inventories 23.3
Other current assets 14.6
Cash and cash equivalents 9.5
Assets classified as held for sale 151.1
Less:
Non-current liabilities (1.9)
Accounts payable (37.3)
Accrued expenses (12.0)
Assets classified as held for sale, net of
liabilities associated with assets held for sale 99.9
An impairment loss of 64.3 million was recorded in discontinued operations to write
down the value of Delvita to fair value less costs to sell (EUR 99.9 million)
See also Note 27 for a discussion of discontinued operations.
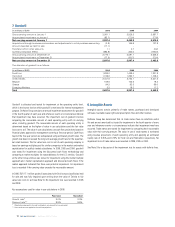
6. Segment Information
Delhaize Group’s primary segment reporting is geographical because its risks
and returns are affected predominately by the fact that it operates in different
countries. Delhaize Group is engaged in one line of business, the operation of
retail food supermarkets, under different banners that have similar economic and
operating characteristics.
The operation of retail food supermarkets represents approximately 91% of
Delhaize Group’s consolidated net sales and other revenues and was its only
reportable business segment in 2006, 2005 and 2004.
/ ANNUAL REPORT 2006
68