Food Lion 2001 Annual Report Download - page 71
Download and view the complete annual report
Please find page 71 of the 2001 Food Lion annual report below. You can navigate through the pages in the report by either clicking on the pages listed below, or by using the keyword search tool below to find specific information within the annual report.-
 1
1 -
2
-
3
-
4
-
5
-
6
-
7
-
8
-
9
-
10
-
11
-
12
-
13
-
14
-
15
-
16
-
17
-
18
-
19
-
20
-
21
-
22
-
23
-
24
-
25
-
26
-
27
-
28
-
29
-
30
-
31
-
32
-
33
-
34
-
35
-
36
-
37
-
38
-
39
-
40
-
41
-
42
-
43
-
44
-
45
-
46
-
47
-
48
-
49
-
50
-
51
-
52
-
53
-
54
-
55
-
56
-
57
-
58
-
59
-
60
-
 61
61 -
 62
62 -
 63
63 -
 64
64 -
 65
65 -
 66
66 -
 67
67 -
 68
68 -
 69
69 -
 70
70 -
 71
71 -
 72
72 -
 73
73 -
 74
74 -
 75
75 -
 76
76 -
 77
77 -
 78
78 -
 79
79 -
 80
80 -
 81
81 -
82
-
83
-
84
-
85
-
86
-
87
-
88
-
89
-
90
-
91
-
92
 |
 |
|69
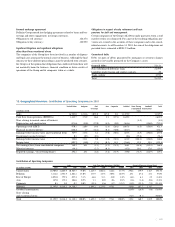
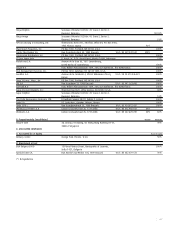
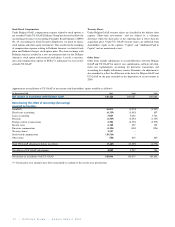
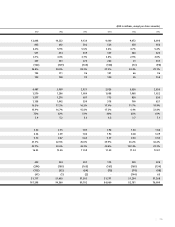
Income Statement (in thousands of EUR)
2001 2000
Operating income 3,231,057 3,000,731
Sales 3,201,067 2,975,138
Other operating income 29,990 25,593
Operating expenses (3,163,915) (2,922,908)
Merchandise and consumables 2,462,708 2,293,789
Salaries, social security and pensions 421,752 390,490
Other operating expenses 279,455 238,629
Operating result 67,142 77,823
Income from financial fixed assets 146,431 115,135
Net financial expense (69,103) (60,934)
Current profit before taxation 144,470 132,025
Exceptional income 480 84
Exceptional expenses (939) (772)
Current year profit before taxation 144,011 131,336
Transfer (-) to/ release (+)
from deferred taxes (2) (10)
Current taxation (2,375) (9,720)
Financial year results 141,634 121,606
Transfer (-) to/ release (+)
from tax-exempt reserves (3) (15)
Financial year results to be appropriated 141,631 121,591
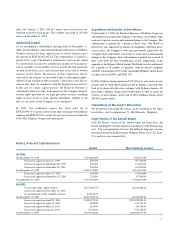
Share capital
(in thousands of EUR) Number of Shares
Share capital
Shares in issue (account n°100 of liabilities and shareholders’equity)
• At the end of the previous year 26,016 -
• Issue of new shares 90 179,450
• Shares exchange 20,091 40,181,529
• At the end of the financial year 46,197 -
Analysis of share capital
Class of shares
• Ordinary shares of no par value 46,197 92,392,704
Registered shares or bearer shares
• Registered - 5,235,377
• Bearer - 87,157,327
Treasury shares held by
• The company itself 11,234 192,200
• Its subsidiaries 6,210 106,252
Commitments to issue new shares
On the exercise of subscription rights
• Number of subscription rights in issue - 249,900
• Amount of capital to be subscribed 124 -
• Corresponding maximum number of shares to be issued - 249,900
Unissued authorized capital 5,835 -
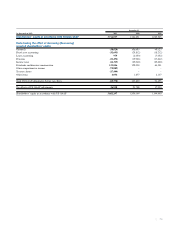
Appropriation of Profit (in thousands of EUR)
2001 2000
Profit carried forward from previous year 4,284 8,766
Transfer to legal reserve (2,018) (85)
Profit to carry forward (9,368) (4,284)
Dividends to shareholders (133,423) (125,039)
Directors’share of profit (1,106) (949)
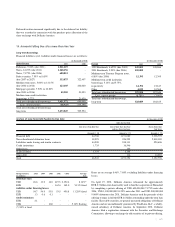
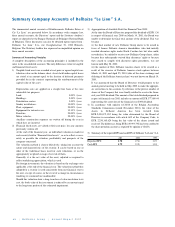
6) Summary Company Accounts of Delhaize “Le Lion” S.A.
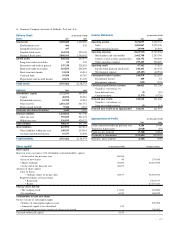
Balance Sheet (in thousands of EUR)
ASSETS 2001 2000
Fixed assets 4,110,680 1,600,980
Establishment costs 466 530
Intangible fixed assets 397
Tangible fixed assets 261,254 250,108
Financial fixed assets 3,848,563 1,350,342
Current assets 656,782 537,573
Long-term trade receivables 99 198
Inventories and work in process 247,338 228,825
Short-term trade receivables 319,855 206,649
Short-term investments 11,234 16,014
Cash and bank 55,584 62,782
Prepayments and accrued income 22,672 23,105
Total assets 4,767,462 2,138,553
LIABILITIES 2001 2000
Shareholders’ equity 2,752,591 487,314
Capital 46,196 26,016
Distributable reserves 15,702 15,263
Other reserves 2,681,325 441,751
Profit carried forward 9,368 4,284
Provisions and deferred taxation 2,640 3,929
Financial liabilities 1,244,182 927,706
After one year 707,189 501,374
Within one year 536,993 426,332
Trade creditors 500,157 471,790
Other liabilities 267,892 247,814
Other liabilities within one year 248,555 235,014
Accruals and deferred income 19,337 12,800
Total liabilities 4,767,462 2,138,553