Food Lion 2001 Annual Report Download - page 60
Download and view the complete annual report
Please find page 60 of the 2001 Food Lion annual report below. You can navigate through the pages in the report by either clicking on the pages listed below, or by using the keyword search tool below to find specific information within the annual report.-
 1
1 -
2
-
3
-
4
-
5
-
6
-
7
-
8
-
9
-
10
-
11
-
12
-
13
-
14
-
15
-
16
-
17
-
18
-
19
-
20
-
21
-
22
-
23
-
24
-
25
-
26
-
27
-
28
-
29
-
30
-
31
-
32
-
33
-
34
-
35
-
36
-
37
-
38
-
39
-
40
-
41
-
42
-
43
-
44
-
45
-
46
-
47
-
48
-
49
-
 50
50 -
 51
51 -
 52
52 -
 53
53 -
 54
54 -
 55
55 -
 56
56 -
 57
57 -
 58
58 -
 59
59 -
 60
60 -
 61
61 -
 62
62 -
 63
63 -
 64
64 -
 65
65 -
 66
66 -
 67
67 -
 68
68 -
 69
69 -
 70
70 -
71
-
72
-
73
-
74
-
75
-
76
-
77
-
78
-
79
-
80
-
81
-
82
-
83
-
84
-
85
-
86
-
87
-
88
-
89
-
90
-
91
-
92
 |
 |

58 |Delhaize Group |Annual Report 2001
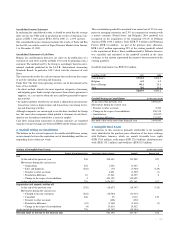
4. Establishement Costs
Establishment costs represent debt issuance costs at Delhaize America,
Delhaize “Le Lion” and Delhaize “The Lion” Nederland.
Analysis of Establishment Costs (in thousands of EUR)
Net book value at the end of the previous financial year 3,641
Movements during the current year:
• Newly incurred costs 22,205
• Depreciation (1,747)
• Translation difference 500
Net book value at the end of the financial year 24,599
Being: debt issuance costs 24,599
Newly incurred costs are related to the issuance by Delhaize America of
bonds and debentures for a total amount of USD 2.6 billion, and the
issuance by Delhaize “The Lion” Nederland of a EUR 150 million
Eurobond.
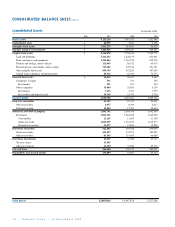
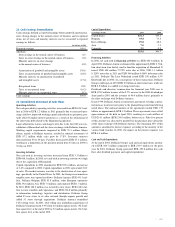
5. Tangible Fixed Assets
(in millions of EUR) 2001 2000
United States 3,432.5 3,086.1
Belgium 430.9 390.7
Rest of Europe 317.3 289.6
Asia 25.5 23.0
Corporate 10.7 2.7
4,216.9 3,792.1
Changes in tangible fixed assets were as follows:
Acquisitions: 628.8 million
Disposals: (46.4) million
Depreciation: (575.2) million
Foreign exchange: 189.1 million
Change in scope of consolidation: 239.0 million
Transfers: (10.5) million
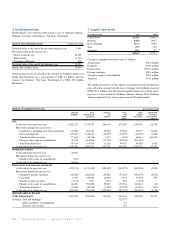
The significant increase of this caption arose primarily from the purchase
price allocation arising from the share exchange with Delhaize America
(EUR 220.6 million were allocated to tangible fixed assets) and the open-
ing of new stores mainly by Delhaize America. During 2001, Delhaize
America opened 47 new stores and renovated 145 supermarkets.
Analysis of Tangible Fixed Assets (in thousands of EUR)
Land and Plant, Furniture Leases Other Capital Work
Buildings Machinery and and and Tangible in Progress
Equipment Vehicles Similar Fixed Assets and Payments
Rights in Advance
Cost
At the end of the previous year 1,422,327 2,338,127 286,974 817,589 1,105,651 65,326
Movements during the current year:
• Acquisitions, including own work capitalized 91,080 265,143 52,546 75,228 70,777 74,080
• Sales and disposals (27,601) (122,671) (18,278) (18,993) (38,791) (1,086)
• Transfer to other accounts 17,641 (10,134) 1,013 (648) 68,611 (84,501)
• Change in the scope of consolidation 38,950 (568,946) (71,220) (33,050) (211,687)
• Translation difference 67,189 105,419 11,326 44,672 49,658 3,638
At the end of the financial year 1,609,586 2,006,938 262,361 884,798 1,044,219 57,457
Revaluation surplus
At the end of the previous year 32,961
Movements during the current year:
• Change in the scope of consolidation (267)
At the end of the financial year 32,694 -
Depreciation and amounts written off
At the end of the previous year (229,133) (1,174,549) (198,242) (239,075) (432,826) (2,981)
Movements during the current year:
• Charged to income statement (60,369) (282,004) (39,551) (53,425) (134,393) (5,375)
• Cancelled 2,395 119,604 16,804 5,792 35,805 597
• Transfer to other accounts (3,122) 2,313 (315) 589 (1,893)
• Change in the scope of consolidation 68,898 592,052 79,537 139,741 204,814 (43)
• Translation difference (8,698) (49,870) (7,189) (10,779) (15,961) (323)
At the end of the financial year (230,029) (792,454) (148,956) (157,157) (344,454) (8,125)
Net book value at the end
of the financial year 1,412,251 1,214,484 113,405 727,641 699,765 49,332
of which: land and buildings 727,477
plant, machinery and equipment 13
furniture and vehicles 151