Food Lion 2001 Annual Report Download - page 65
Download and view the complete annual report
Please find page 65 of the 2001 Food Lion annual report below. You can navigate through the pages in the report by either clicking on the pages listed below, or by using the keyword search tool below to find specific information within the annual report.-
 1
1 -
2
-
3
-
4
-
5
-
6
-
7
-
8
-
9
-
10
-
11
-
12
-
13
-
14
-
15
-
16
-
17
-
18
-
19
-
20
-
21
-
22
-
23
-
24
-
25
-
26
-
27
-
28
-
29
-
30
-
31
-
32
-
33
-
34
-
35
-
36
-
37
-
38
-
39
-
40
-
41
-
42
-
43
-
44
-
45
-
46
-
47
-
48
-
49
-
50
-
51
-
52
-
53
-
54
-
 55
55 -
 56
56 -
 57
57 -
 58
58 -
 59
59 -
 60
60 -
 61
61 -
 62
62 -
 63
63 -
 64
64 -
 65
65 -
 66
66 -
 67
67 -
 68
68 -
 69
69 -
 70
70 -
 71
71 -
 72
72 -
 73
73 -
 74
74 -
 75
75 -
76
-
77
-
78
-
79
-
80
-
81
-
82
-
83
-
84
-
85
-
86
-
87
-
88
-
89
-
90
-
91
-
92
 |
 |

|63
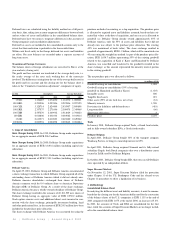
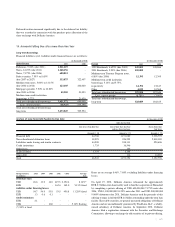
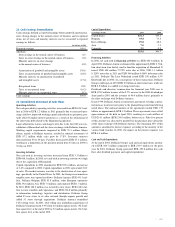
Forward exchange agreement
Delhaize Group entered into hedging agreements related to loans and bor-
rowings and other engagements in foreign currencies.
Obligation to sell currency: 126,474
Obligation to buy currency: 120,990
Significant litigation and significant obligations
other than those mentioned above
The companies of the Group have been involved in a number of disputes
and legal cases arising in the normal course of business. Although the final
outcome of these different proceedings cannot be predicted with certainty,
the Group is of the opinion that obligations that could result from them will
not materially harm the business, financial condition or future results of
operations of the Group and its companies taken as a whole.
Obligations in respect of early retirement and basic
pensions for staff and management
Certain companies of the Group (Alfa-Beta) make payments when a staff
member retires or is dismissed. For a part of the resulting obligations pro-
visions are created in the accounts of these companies and in the consol-
idated accounts. As of December 31, 2001, the sum of the obligations not
provided for is estimated at EUR 2.5 million.
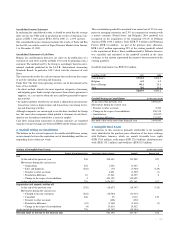
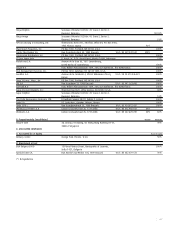
Guaranteed debts
Debts (or parts of debts) guaranteed by mortgages or securities charges
granted or irrevocably promised on the Company’s assets
Financial debts 72,121
Non-subordinated debenture loans 72,099
Liabilities under leasing and similar contracts 22
Trade creditor 3,933
Total 76,055
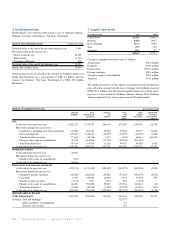
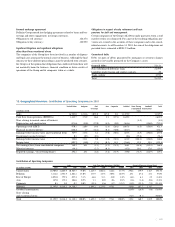
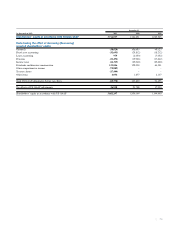
18. Geographical Overview: Contribution of Operating Companies in 2001
United States Belgium Rest Asia Corporate Subtotal Store Closing Goodwill Total
of Europe & Exceptional Amortization
in millions of EUR Items
Sales 16,905.0 3,212.6 1,091.0 187.0 0.3 21,395.9 21,395.9
Cash flow from operations (EBITDA) 1,445.7 173.9 46.6 2.3 (19.3) 1,649.2 1,649.2
Store closing in normal course of business (8.5) (8.5)
Depreciation and amortization (475.6) (53.0) (27.0) (4.9) (0.9) (561.4) (158.0) (719.4)
Operating result (EBIT) 970.1 120.9 19.6 (2.6) (20.2) 1,087.8 (8.5) (158.0) 921.3
Financial income/(expense) (420.2) 2.7 (16.4) (0.4) (30.0) (464.3) (464.3)
Earnings before income taxes and exceptional items 549.9 123.6 3.2 (3.0) (50.2) 623.5 (8.5) (158.0) 457.0
Exceptional income/(expense) 0.1 (0.5) (0.2) (0.6) (95.8) (96.4)
Earnings before income taxes 550.0 123,1 3.0 (3.0) (50.2) 622.9 (104.3) (158.0) 360.6
Income taxes (209.7) (38.0) (7.1) (0.3) 18.3 (236.8) 19.5 25.5 (191.8)
Net earnings/(loss) from consolidated companies 340.3 85,1 (4.1) (3.3) (31.9) 386.1 (84.8) (132.5) 168.8
Minority interests (44.1) (2.7) (0.3) (47.1) 10.1 17.6 (19.4)
Reported earnings / (loss)(Group Share) 296.2 85.1 (6.8) (3.6) (31.9) 339.0 (74.7) (114.9) 149.4
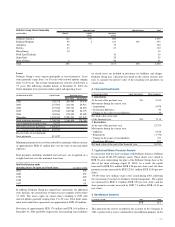
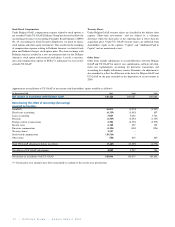
Contribution of Operating Companies
Sales Cash Flow from Operations (EBITDA) Reported Earnings (Group Share)
(in millions of EUR) 2001 2000 1999 %2001 2001 2000 1999 %2001 2001 2000 1999 %2001
United States 16,905.0 14,069.5 10,505.7 79.0% 1,445.7 1,086.2 828.4 87.7% 296.2 139.9 136.7 198.3%
Belgium 3,212.6 2,983.5 2,802.2 15.0% 173.9 147.5 109.8 10.5% 85.1 67.6 43.1 57.0%
Rest of Europe 1,091.0 959.4 895.4 5.1% 46.6 51.3 43.0 2.8% (6.8) 6.3 2.5 (4.6)%
Asia 187.0 155.3 106.6 0.9% 2.3 (0.9) 0.6 0.2% (3.6) (3.6) (0.4) (2.4)%
Corporate 0.3 0.5 0.2 0.0% (19.3) (9.6) (5.7) (1.2)% (31.9) (22.5) (7.2) (21.4)%
Subtotal 21,395.9 18,168.2 14,310.1 1,649.2 1,274.5 976.1 339.0 187.7 174.7
Goodwill amortization (114.9) (26.9) (4.8) (76.9)%
Store closing
and exceptional items (74.7) (0.1) (50,0)%
Total 21,395.9 18,168.2 14,310.1 100.0% 1,649.2 1,274.5 976.1 100.0% 149.4 160.7 169.9 100,0%