Food Lion 2001 Annual Report Download - page 3
Download and view the complete annual report
Please find page 3 of the 2001 Food Lion annual report below. You can navigate through the pages in the report by either clicking on the pages listed below, or by using the keyword search tool below to find specific information within the annual report.-
 1
1 -
 2
2 -
 3
3 -
 4
4 -
 5
5 -
 6
6 -
 7
7 -
 8
8 -
 9
9 -
 10
10 -
 11
11 -
 12
12 -
 13
13 -
 14
14 -
15
-
16
-
17
-
18
-
19
-
20
-
21
-
22
-
23
-
24
-
25
-
26
-
27
-
28
-
29
-
30
-
31
-
32
-
33
-
34
-
35
-
36
-
37
-
38
-
39
-
40
-
41
-
42
-
43
-
44
-
45
-
46
-
47
-
48
-
49
-
50
-
51
-
52
-
53
-
54
-
55
-
56
-
57
-
58
-
59
-
60
-
61
-
62
-
63
-
64
-
65
-
66
-
67
-
68
-
69
-
70
-
71
-
72
-
73
-
74
-
75
-
76
-
77
-
78
-
79
-
80
-
81
-
82
-
83
-
84
-
85
-
86
-
87
-
88
-
89
-
90
-
91
-
92
 |
 |
|1
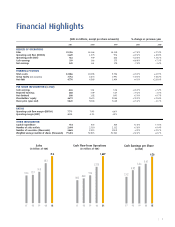
(EUR in millions, except per share amounts) % change vs previous year
2001 2000 1999
2001 2000
RESULTS OF OPERATIONS
Sales 21,396 18,168 14,310 +17.8% +27.0%
Operating cash flow (EBITDA) 1,649 1,275 976 +29.4% +30.6%
Operating profit (EBIT) 921 739 648 +24.6% +14.1%
Cash earnings 339 188 175 +80.6% +7.5%
Net earnings 149 161 170 –7.0% –5.4%
FINANCIAL POSITION
Total assets 12,086 10,398 5,728 +16.2% +81.5%
Group equity (incl. minorities) 3,752 2,874 1,991 +30.5% +44.4%
Net debt 4,776 4,589 1,404 +4.1% +226.8%
PER SHARE INFORMATION (in EUR)
Cash earnings 4.26 3.61 3.36 +18.2% +7.4%
Reported earnings 1.88 3.09 3.27 –39.2% –5.5%
Net dividend 1.08 1.02 0.93 +5.9% +9.7%
Shareholders' equity 46.75 26.23 20.88 +78.2% +25.6%
Share price (year-end) 58.45 50.65 74.80 +15.4% –32.3%
RATIOS
Operating cash flow margin (EBITDA) 7.7% 7.0% 6.8%
Operating margin (EBIT) 4.3% 4.1% 4.5%
OTHER INFORMATION
Capital expenditure 554 545 525 +1.6% +3.8%
Number of sales outlets 2,444 2,310 2,112 +5.8% +9.4%
Number of associates (thousands) 146.8 152.5 124.9 –4.2% +22.1%
Weighted average number of shares (thousands) 79,494 52,023 51,983 +52.8% +0.1%
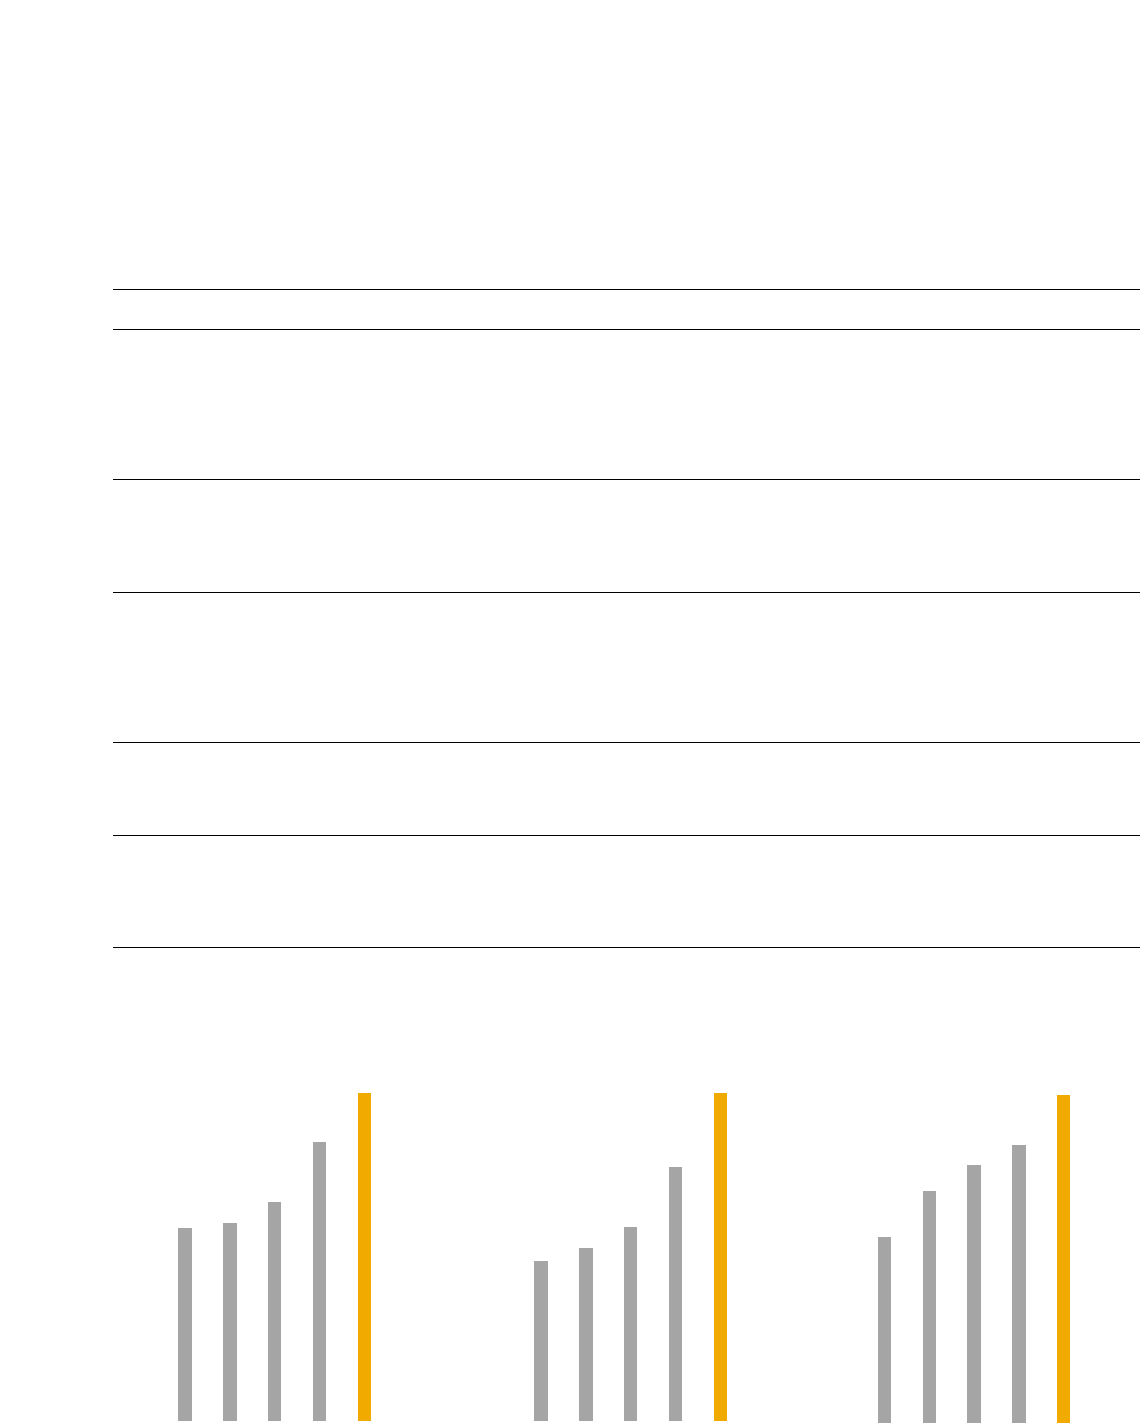
Financial Highlights
12.6 12.9
Sales
(in billions of EUR)
14.3
18.2
21.4
805 868
Cash Flow from Operations
(in millions of EUR)
976
1,275
1,649
2.42
3.02
Cash Earnings per Share
(in EUR)
3.36 3.61
4.26
97 98 99 00 01 97 98 99 00 01
97 98 99 00 01