Food Lion 2001 Annual Report Download - page 53
Download and view the complete annual report
Please find page 53 of the 2001 Food Lion annual report below. You can navigate through the pages in the report by either clicking on the pages listed below, or by using the keyword search tool below to find specific information within the annual report.-
 1
1 -
2
-
3
-
4
-
5
-
6
-
7
-
8
-
9
-
10
-
11
-
12
-
13
-
14
-
15
-
16
-
17
-
18
-
19
-
20
-
21
-
22
-
23
-
24
-
25
-
26
-
27
-
28
-
29
-
30
-
31
-
32
-
33
-
34
-
35
-
36
-
37
-
38
-
39
-
40
-
41
-
42
-
 43
43 -
 44
44 -
 45
45 -
 46
46 -
 47
47 -
 48
48 -
 49
49 -
 50
50 -
 51
51 -
 52
52 -
 53
53 -
 54
54 -
 55
55 -
 56
56 -
 57
57 -
 58
58 -
 59
59 -
 60
60 -
 61
61 -
 62
62 -
 63
63 -
64
-
65
-
66
-
67
-
68
-
69
-
70
-
71
-
72
-
73
-
74
-
75
-
76
-
77
-
78
-
79
-
80
-
81
-
82
-
83
-
84
-
85
-
86
-
87
-
88
-
89
-
90
-
91
-
92
 |
 |

|51
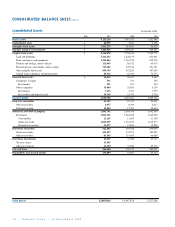
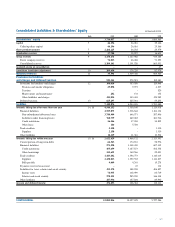
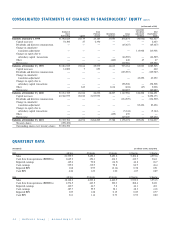
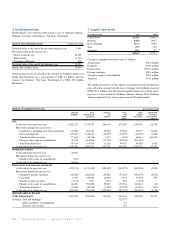
Consolidated Liabilities & Shareholders’ Equity (in thousands of EUR)
Note 2001 2000 1999
Shareholders’ equity 3,716,037 1,364,691 1,085,565
Capital 746,196 26,016 25,166
Called up share capital 46,196 26,016 25,166
Share premium account 72,264,225 26,232 25,579
Revaluation reserves 817,788 18,227 16,613
Group reserves 91,178,174 1,167,988 935,184
Parent company reserves 74,013 66,468 71,253
Consolidated reserves 1,104,161 1,101,520 863,931
Goodwill arising on consolidation --47
Cumulative translation adjustment 10 209,654 126,228 82,976
Minority interests 11 35,594 1,509,720 905,360
Provisions for liabilities
and charges and deferred taxation 993,311 578,591 185,181
Provisions for liabilities and charges 12 368,014 353,550 129,948
Pensions and similar obligations 25,898 9,973 4,307
Taxation -- 520
Major repairs and maintenance 282 134 132
Other liabilities and charges 341,834 343,443 124,989
Deferred taxation 13 625,297 225,041 55,233
Creditors 7,340,874 6,944,676 3,551,480
Amounts falling due after more than one year 14, 16 4,546,152 1,350,160 1,115,978
Financial liabilities 4,529,875 1,338,844 1,104,134
Non-subordinated debenture loans 3,744,444 646,571 587,496
Liabilities under financing leases 768,739 649,065 481,746
Credit institutions 16,546 37,904 34,892
Other loans 146 5,304 -
Trade creditors 2,158 - 1,310
Suppliers 2,158 - 1,310
Other liabilities 14,119 11,316 10,534
Amounts falling due within one year 15, 16 2,622,429 5,466,132 2,323,391
Current portion of long-term debts 66,543 174,831 58,976
Financial liabilities 571,298 3,348,439 607,339
Credit institutions 455,659 3,187,873 582,338
Other borrowings 115,639 160,566 25,001
Trade creditors 1,443,482 1,396,773 1,160,115
Suppliers 1,438,813 1,392,532 1,144,837
Bills payable 4,669 4,241 15,278
Payments received on account -47 114
Liabilities for taxes, salaries and social security 353,170 388,238 406,857
Income taxes 74,935 102,999 60,719
Salaries and social security 278,235 285,239 346,138
Other liabilities 187,936 157,804 89,990
Accruals and deferred income 172,293 128,384 112,111
Total liabilities 12,085,816 10,397,678 5,727,586