Food Lion 2001 Annual Report Download - page 56
Download and view the complete annual report
Please find page 56 of the 2001 Food Lion annual report below. You can navigate through the pages in the report by either clicking on the pages listed below, or by using the keyword search tool below to find specific information within the annual report.-
 1
1 -
2
-
3
-
4
-
5
-
6
-
7
-
8
-
9
-
10
-
11
-
12
-
13
-
14
-
15
-
16
-
17
-
18
-
19
-
20
-
21
-
22
-
23
-
24
-
25
-
26
-
27
-
28
-
29
-
30
-
31
-
32
-
33
-
34
-
35
-
36
-
37
-
38
-
39
-
40
-
41
-
42
-
43
-
44
-
45
-
 46
46 -
 47
47 -
 48
48 -
 49
49 -
 50
50 -
 51
51 -
 52
52 -
 53
53 -
 54
54 -
 55
55 -
 56
56 -
 57
57 -
 58
58 -
 59
59 -
 60
60 -
 61
61 -
 62
62 -
 63
63 -
 64
64 -
 65
65 -
 66
66 -
67
-
68
-
69
-
70
-
71
-
72
-
73
-
74
-
75
-
76
-
77
-
78
-
79
-
80
-
81
-
82
-
83
-
84
-
85
-
86
-
87
-
88
-
89
-
90
-
91
-
92
 |
 |

54 |Delhaize Group |Annual Report 2001
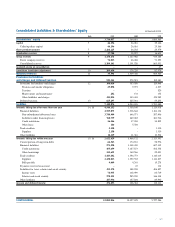
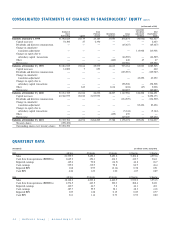
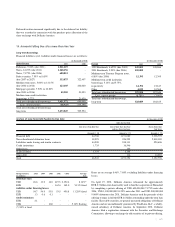
CONSOLIDATED STATEMENTS OF CHANGES IN SHAREHOLDERS’ EQUITY (note 1)
(in thousands of EUR)
Cumulative
Number of Share Translation Total
Shares Premium Revaluation Group Adjustment Shareholders’
Outstanding Capital Account Reserves Reserves and Other Equity
Balances at January 1, 1999 51,962,625 25,139 23,183 17,053 876,874 (30,932) 911,317
Capital increases 54,300 27 2,396 — — — 2,423
Dividends and directors remuneration — ———(65,427) — (65,427)
Change in cumulative
translation adjustment — — — —— 113,908 113,908
Changes in equity due to
subsidiary capital transactions — — ——(46,589) — (46,589)
Other —— —(440) 440 47 47
Net income —— — — 169,886 — 169,886
Balances at December 31, 1999 52,016,925 25,166 25,579 16,613 935,184 83,023 1,085,565
Capital increases 14,800 7 653 ——— 660
Dividends and directors remuneration — —— — (125,987) — (125,987)
Change in cumulative
translation adjustment —— — —— 43,252 43,252
Changes in equity due to
subsidiary capital transactions — — — — 198,508 — 198,508
Other — 843 — 1,614 (404) (47) 2,006
Net income —— — — 160,687 — 160,687
Balances at December 31, 2000 52,031,725 26,016 26,232 18,227 1,167,988 126,228 1,364,691
Capital increases 40,360,979 20,180 2,237,993 — — — 2,258,173
Dividends and directors remuneration — —— — (134,529) — (134,529)
Change in cumulative
translation adjustment — — —— — 83,426 83,426
Changes in equity due to
subsidiary capital transactions — — — — (5,144) — (5,144)
Other —— — (439) 439 — —
Net income — — — — 149,420 — 149,420
Balances at December 31, 2001 92,392,704 46,196 2,264,225 17,788 1,178,174 209,654 3,716,037
Treasury shares (298,452)
Outstanding shares excl. treasury shares 92,094,252
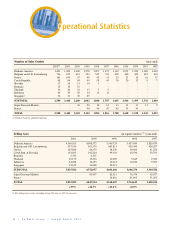
QUARTERLY DATA
(Unaudited) (in millions of EUR, except EPS)
2001 Full Year 4th Quarter 3rd Quarter 2nd Quarter 1st Quarter
Sales 21,395.9 5,452.3 5,453.2 5,496.8 4,993.6
Cash flow from operations (EBITDA) 1,649.2 456.1 414.3 412.7 366.1
Reported earnings 149.4 90.8 (14.9) 46.8 26.7
Cash earnings 339.0 112.9 92.8 86.9 46.4
Reported EPS 1.88 0.99 (0.16) 0.58 0.51
Cash EPS 4.26 1,23 1.00 1.07 0.89
2000 Full Year 4th Quarter 3rd Quarter 2nd Quarter 1st Quarter
Sales 18,168.2 6,223.8 4,460.9 3,932.0 3,551.5
Cash flow from operations (EBITDA) 1,274.5 463.5 300.3 268.6 242.1
Reported earnings 160.7 66.7 7.8 46.1 40.1
Cash earnings 187.7 59.5 38.1 48.3 41.8
Reported EPS 3.09 1.28 0.15 0.89 0.77
Cash EPS 3.61 1.14 0.73 0.93 0.80