Food Lion 2001 Annual Report Download - page 54
Download and view the complete annual report
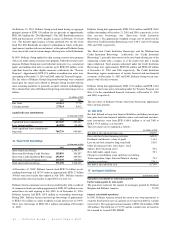
Please find page 54 of the 2001 Food Lion annual report below. You can navigate through the pages in the report by either clicking on the pages listed below, or by using the keyword search tool below to find specific information within the annual report.-
 1
1 -
2
-
3
-
4
-
5
-
6
-
7
-
8
-
9
-
10
-
11
-
12
-
13
-
14
-
15
-
16
-
17
-
18
-
19
-
20
-
21
-
22
-
23
-
24
-
25
-
26
-
27
-
28
-
29
-
30
-
31
-
32
-
33
-
34
-
35
-
36
-
37
-
38
-
39
-
40
-
41
-
42
-
43
-
 44
44 -
 45
45 -
 46
46 -
 47
47 -
 48
48 -
 49
49 -
 50
50 -
 51
51 -
 52
52 -
 53
53 -
 54
54 -
 55
55 -
 56
56 -
 57
57 -
 58
58 -
 59
59 -
 60
60 -
 61
61 -
 62
62 -
 63
63 -
 64
64 -
65
-
66
-
67
-
68
-
69
-
70
-
71
-
72
-
73
-
74
-
75
-
76
-
77
-
78
-
79
-
80
-
81
-
82
-
83
-
84
-
85
-
86
-
87
-
88
-
89
-
90
-
91
-
92
 |
 |

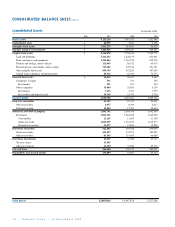
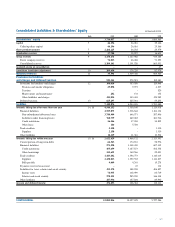
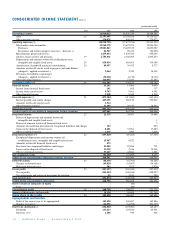
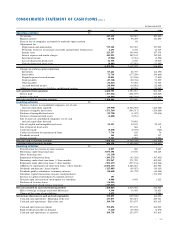
52 |Delhaize Group |Annual Report 2001
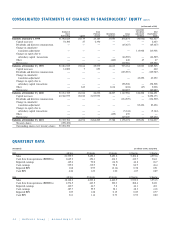
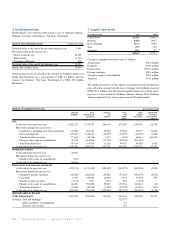
CONSOLIDATED INCOME STATEMENT (note 1)
(in thousands of EUR)
Note 2001 2000 1999
Operating income 21,920,023 18,576,729 14,589,206
Sales 18 21,395,945 18,168,166 14,310,129
Other operating income 524,078 408,563 279,077
Operating expenses (–) (20,998,720) (17,837,216) (13,941,024)
Merchandise and consumables 15,968,370 13,695,993 10,806,796
Purchases 15,881,843 13,605,519 10,893,052
Inventories and work in progress (increase –, decrease +) 86,527 90,474 (86,256)
Miscellaneous goods and services 1,439,853 1,239,784 955,603
Salaries, social security and pensions 19 2,783,011 2,328,085 1,805,243
Depreciation and amounts written off establishment costs,
intangible and tangible fixed assets 20 629,436 465,563 319,188
Amortization of goodwill arising on consolidation 20 89,957 39,932 8,717
Amounts written off stocks, work in progress and trade debtors
(charged +, applied or released –) 2,264 3,330 16,318
Provisions for liabilities and charges
(charged +, applied or released –) (30,226) (6,715) (8,134)
Other operating expenses 116,055 71,244 37,293
Operating profit (+) 18 921,303 739,513 648,182
Financial income 15,242 15,060 9,040
Income from financial fixed assets 161 655 137
Income from current assets 9,743 9,063 4,391
Other financial income 5,338 5,342 4,512
Financial expenses (–) 21 (479,504) (311,284) (149,154)
Interest payable and similar charges 445,295 282,132 130,932
Amounts written off current assets 1,514 --
Other financial expenses 32,695 29,152 18,222
Net financial results (464,262) (296,224) (140,114)
Current profit of consolidated companies before taxation 457,041 443,289 508,068
Exceptional income 22 11,379 38,961 19,640
Release of depreciation and amounts written off
intangible and tangible fixed assets --1
Release of amounts written off financial fixed assets --3
Amounts released from provisions for exceptional liabilities and charges 343 - 523
Gains on the disposal of fixed assets 8,401 37,961 17,685
Other exceptional income 2,635 1,000 1,428
Exceptional expenses (–) 22 (107,829) (80,260) (17,005)
Exceptional depreciation and amounts written off
establishment costs, intangible and tangible fixed assets 15,947 6,872 -
Amounts written off financial fixed assets 475 --
Provisions for exceptional liabilities and charges 21,402 27,866 731
Losses on the disposal of fixed assets 12,558 2,636 15,046
Other exceptional expenses 57,447 42,886 1,228
Net exceptional results (96,450) (41,299) 2,635
Profit of the consolidated companies before taxation 360,591 401,990 510,703
Deferred taxation 23 (68,436) (41,784) (32,188)
Transfer to deferred taxes (69,029) (43,607) (34,108)
Release of deferred taxes 593 1,823 1,920
Tax on profits 23 (123,397) (103,944) (157,339)
Tax on profits (123,452) (105,046) (158,097)
Tax adjustments and release of provisions for taxation 55 1,102 758
Total income taxes (191,833) (145,728) (189,527)
Profit of the consolidated companies 168,758 256,262 321,176
Share in results of companies at equity -(80) -
Loss -(80) -
Consolidated profit 18 168,758 256,182 321,176
Interest of third parties in the results 19,338 95,495 151,290
Group share in the results 24 149,420 160,687 169,886
Appropriations and transfers
Profit of the current year to be appropriated 149,420 160,687 169,886
Transfer to reserves (14,891) (34,700) (104,459)
Profit to be distributed (–) (134,529) (125,987) (65,427)
Dividends 133,423 125,038 64,501
Directors’fees 1,106 949 926