Dollar Tree 2014 Annual Report Download - page 9
Download and view the complete annual report
Please find page 9 of the 2014 Dollar Tree annual report below. You can navigate through the pages in the report by either clicking on the pages listed below, or by using the keyword search tool below to find specific information within the annual report.-
 1
1 -
 2
2 -
 3
3 -
 4
4 -
 5
5 -
 6
6 -
 7
7 -
 8
8 -
 9
9 -
 10
10 -
 11
11 -
 12
12 -
 13
13 -
 14
14 -
 15
15 -
 16
16 -
 17
17 -
 18
18 -
 19
19 -
 20
20 -
21
-
22
-
23
-
24
-
25
-
26
-
27
-
28
-
29
-
30
-
31
-
32
-
33
-
34
-
35
-
36
-
37
-
38
-
39
-
40
-
41
-
42
-
43
-
44
-
45
-
46
-
47
-
48
-
49
-
50
-
51
-
52
-
53
-
54
-
55
-
56
-
57
-
58
-
59
-
60
-
61
-
62
-
63
-
64
-
65
-
66
-
67
-
68
-
69
-
70
-
71
-
72
-
73
-
74
-
75
-
76
-
77
-
78
-
79
-
80
-
81
-
82
-
83
-
84
-
85
-
86
-
87
-
88
-
89
-
90
-
91
-
92
-
93
-
94
-
95
-
96
-
97
-
98
-
99
-
100
 |
 |
7
Dollar Tree Annual Report 2014
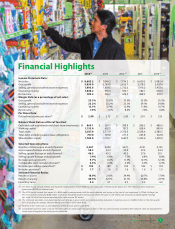
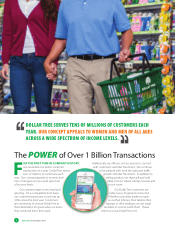
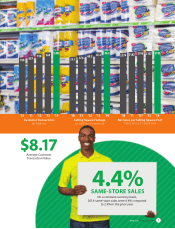
Average Customer
Transaction Value
$8.17
'10 '11 '12 '13 '14
Customer Transactions
(in Millions)
829
918
969 1,053
748
'10 '11 '12* '13 '14
$182
$190
$187 $192
$174
Net Sales per Selling Square Foot
*2012 was a 53-week year
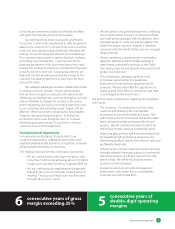
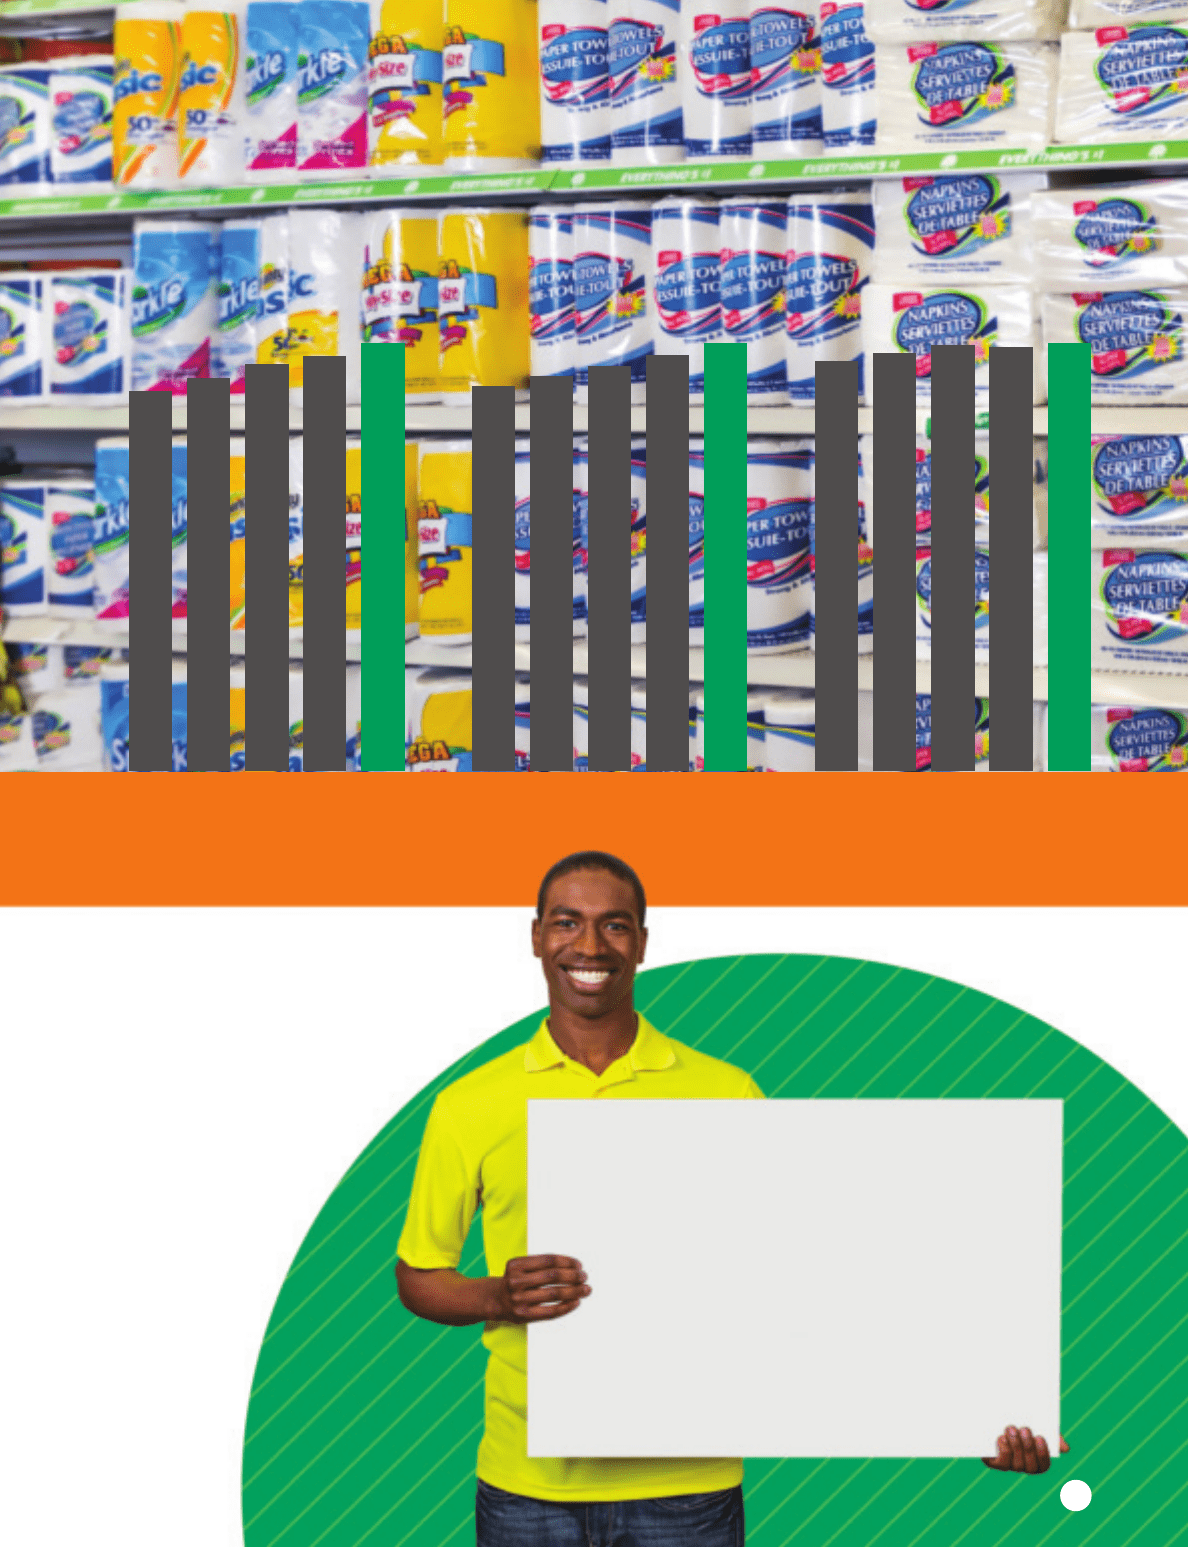
4.4%
On a constant-currency basis,
2014 same-store sales were 4.4% compared
to 2.4% in the prior year.
SAMESTORE SALES
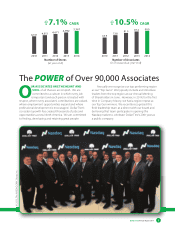
'10 '11 '12 '13 '14
Selling Square Footage
(in Millions at year-end)
37.6
40.5
43.2 46.5
35.1