Dollar Tree 2014 Annual Report Download - page 44
Download and view the complete annual report
Please find page 44 of the 2014 Dollar Tree annual report below. You can navigate through the pages in the report by either clicking on the pages listed below, or by using the keyword search tool below to find specific information within the annual report.-
 1
1 -
2
-
3
-
4
-
5
-
6
-
7
-
8
-
9
-
10
-
11
-
12
-
13
-
14
-
15
-
16
-
17
-
18
-
19
-
20
-
21
-
22
-
23
-
24
-
25
-
26
-
27
-
28
-
29
-
30
-
31
-
32
-
33
-
 34
34 -
 35
35 -
 36
36 -
 37
37 -
 38
38 -
 39
39 -
 40
40 -
 41
41 -
 42
42 -
 43
43 -
 44
44 -
 45
45 -
 46
46 -
 47
47 -
 48
48 -
 49
49 -
 50
50 -
 51
51 -
 52
52 -
 53
53 -
 54
54 -
55
-
56
-
57
-
58
-
59
-
60
-
61
-
62
-
63
-
64
-
65
-
66
-
67
-
68
-
69
-
70
-
71
-
72
-
73
-
74
-
75
-
76
-
77
-
78
-
79
-
80
-
81
-
82
-
83
-
84
-
85
-
86
-
87
-
88
-
89
-
90
-
91
-
92
-
93
-
94
-
95
-
96
-
97
-
98
-
99
-
100
 |
 |

28
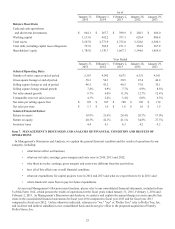
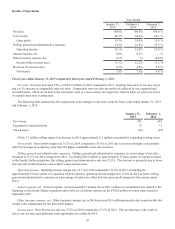
Results of Operations
Year Ended
January 31,
2015
February 1,
2014
February 2,
2013
Net sales 100.0% 100.0% 100.0 %
Cost of sales 64.7% 64.4% 64.1 %
Gross profit 35.3% 35.6% 35.9 %
Selling, general and administrative expenses 23.2% 23.2% 23.5 %
Operating income 12.1% 12.4% 12.4 %
Interest expense, net 0.9% 0.2% — %
Other (income) expense, net 0.1% —% (0.8)%
Income before income taxes 11.1% 12.2% 13.2 %
Provision for income taxes 4.1% 4.6% 4.8 %
Net income 7.0% 7.6% 8.4 %
Fiscal year ended January 31, 2015 compared to fiscal year ended February 1, 2014
Net sales. Net sales increased 9.7%, or $761.9 million, in 2014 compared to 2013, resulting from sales in our new stores
and a 4.3% increase in comparable store net sales. Comparable store net sales are positively affected by our expanded and
relocated stores, which we include in the calculation, and, to a lesser extent, are negatively affected when we open new stores
or expand stores near existing ones.
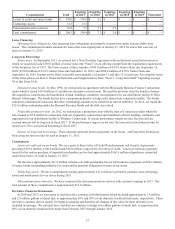
The following table summarizes the components of the changes in our store count for fiscal years ended January 31, 2015
and February 1, 2014.
January 31,
2015
February 1,
2014
New stores 391 343
Expanded or relocated stores 72 71
Closed stores (16)(22)
Of the 3.2 million selling square foot increase in 2014 approximately 0.2 million was added by expanding existing stores.
Gross profit. Gross profit margin was 35.3% in 2014 compared to 35.6% in 2013 due to increased freight costs partially
offset by leverage in occupancy costs from the higher comparable store sales increase.
Selling, general and administrative expenses. Selling, general and administrative expenses, as a percentage of net sales,
remained at 23.2% for 2014 compared to 2013. Excluding $28.5 million or approximately 35 basis points of expenses related
to the Family Dollar acquisition, the selling, general and administrative rate was 22.9%. The decrease is primarily due to lower
store payroll, health insurance and workers' compensation costs.
Operating income. Operating income margin was 12.1% in 2014 compared to 12.4% in 2013. Excluding the
approximately 35 basis points of acquisition-related expenses, operating income margin was 12.4% in 2014 as lower selling,
general and administrative expenses as a percentage of sales were offset by lower gross profit margin for the reasons noted
above.
Interest expense, net. Interest expense, net increased $64.7 million due to $46.7 million of commitment fees related to the
financing of the Family Dollar acquisition and a full year of interest expense on the $750.0 million of senior notes issued in
September 2013.
Other (income) expense, net. Other (income) expense, net in 2014 increased $5.6 million primarily due to unfavorable fair
market value adjustments for our diesel fuel hedges.
Income taxes. Our effective tax rate was 37.2% in 2014 compared to 37.5% in 2013. The rate decrease is the result of
lower state tax rates and additional work opportunity tax credits in 2014.