Dollar Tree 2014 Annual Report Download - page 42
Download and view the complete annual report
Please find page 42 of the 2014 Dollar Tree annual report below. You can navigate through the pages in the report by either clicking on the pages listed below, or by using the keyword search tool below to find specific information within the annual report.-
 1
1 -
2
-
3
-
4
-
5
-
6
-
7
-
8
-
9
-
10
-
11
-
12
-
13
-
14
-
15
-
16
-
17
-
18
-
19
-
20
-
21
-
22
-
23
-
24
-
25
-
26
-
27
-
28
-
29
-
30
-
31
-
 32
32 -
 33
33 -
 34
34 -
 35
35 -
 36
36 -
 37
37 -
 38
38 -
 39
39 -
 40
40 -
 41
41 -
 42
42 -
 43
43 -
 44
44 -
 45
45 -
 46
46 -
 47
47 -
 48
48 -
 49
49 -
 50
50 -
 51
51 -
 52
52 -
53
-
54
-
55
-
56
-
57
-
58
-
59
-
60
-
61
-
62
-
63
-
64
-
65
-
66
-
67
-
68
-
69
-
70
-
71
-
72
-
73
-
74
-
75
-
76
-
77
-
78
-
79
-
80
-
81
-
82
-
83
-
84
-
85
-
86
-
87
-
88
-
89
-
90
-
91
-
92
-
93
-
94
-
95
-
96
-
97
-
98
-
99
-
100
 |
 |
26
Key Events and Recent Developments
Several key events have had or are expected to have a significant effect on our operations. You should keep in mind that:
• On March 9, 2015, we entered into a credit agreement and term loan facilities and received $3.95 billion under the
Term Loan B which is being held in escrow pending the consummation of the Family Dollar acquisition.
• On February 23, 2015, we completed the offering of $3.25 billion of acquisition notes which we expect to use in
connection with our financing of the Family Dollar acquisition. The acquisition notes were issued by a wholly
owned subsidiary of Dollar Tree and the proceeds of the offering are being held in escrow pending the
consummation of the Family Dollar acquisition.
• On January 22, 2015, Family Dollar Stores, Inc. shareholders voted to approve our acquisition of Family Dollar.
• In January 2015, we completed a 270,000 square foot expansion of our distribution center in Joliet, Illinois. The
Joliet distribution center is now a 1,470,000 square foot, fully automated facility.
• On July 27, 2014, we entered into an Agreement and Plan of Merger to acquire Family Dollar in a cash and stock
transaction.
• On September 17, 2013, we entered into agreements with JP Morgan Chase Bank to repurchase $1.0 billion of our
common stock under a variable maturity accelerated share repurchase program, 50% of which was collared and
50% of which was uncollared.
• On September 16, 2013, we completed a private placement with institutional investors of $750 million aggregate
principal amount of Senior Notes. The Senior Notes include three tranches with $300 million of 4.03% Senior
Notes due in September 2020, $350 million of 4.63% Senior Notes due in September 2023 and $100 million of
4.78% Senior Notes due in September 2025.
• On September 13, 2013, our Board of Directors authorized the repurchase of an additional $2.0 billion of our
common stock. This authorization replaced all previous authorizations. At January 31, 2015, we had $1.0 billion
remaining under Board repurchase authorization.
• In August 2013, we completed a 401,000 square foot expansion of our distribution center in Marietta, Oklahoma.
The Marietta distribution center is now a 1,004,000 square foot, fully automated facility.
• In June 2013, we completed construction on a new 1.0 million square foot distribution center in Windsor,
Connecticut.
• In March 2013, we leased an additional 0.4 million square feet at our distribution center in San Bernardino,
California. The San Bernardino distribution center is now an 802,000 square foot facility.
• On June 6, 2012, we entered into a five-year $750.0 million Unsecured Credit Agreement which provides for a
$750.0 million revolving line of credit, including up to $150.0 million in available letters of credit. The interest
rate on the facility is based, at our option, on a LIBOR rate, plus a margin, or an alternate base rate, plus a margin.
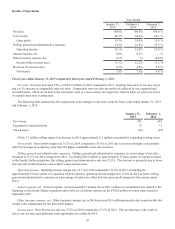
Overview
Our net sales are derived from the sale of merchandise. Two major factors tend to affect our net sales trends. First is our
success at opening new stores or adding new stores through acquisitions. Second, sales vary at our existing stores from one
year to the next. We refer to this change as a change in comparable store net sales, because we compare only those stores that
are open throughout both of the periods being compared. We include sales from stores expanded during the year in the
calculation of comparable store net sales, which has the effect of increasing our comparable store net sales. The term
'expanded' also includes stores that are relocated.
At January 31, 2015, we operated 5,367 stores in 48 states and the District of Columbia, and five Canadian provinces, with
46.5 million selling square feet compared to 4,992 stores with 43.2 million selling square feet at February 1, 2014. During
fiscal 2014, we opened 391 stores, expanded 72 stores and closed 16 stores, compared to 343 new stores opened, 71 stores
expanded and 22 stores closed during fiscal 2013. In the current year we increased our selling square footage by 7.4%. Of the
3.2 million selling square foot increase in 2014, 0.2 million was added by expanding existing stores. The average size of our
stores opened in 2014 was approximately 8,060 selling square feet (or about 10,000 gross square feet). For 2015, we continue
to plan to open stores that are approximately 8,000 - 10,000 selling square feet (or about 10,000 - 12,000 gross square
feet). We believe that this store size is our optimal size operationally and that this size also gives our customers an ideal
shopping environment that invites them to shop longer and buy more.
Fiscal 2014 and Fiscal 2013 which ended on January 31, 2015, and February 1, 2014, respectively, each included 52
weeks. Fiscal 2012 ended on February 2, 2013 and included 53 weeks, commensurate with the retail calendar. The 53rd week
in 2012 added approximately $125 million in sales.