Dollar Tree 2013 Annual Report Download - page 67
Download and view the complete annual report
Please find page 67 of the 2013 Dollar Tree annual report below. You can navigate through the pages in the report by either clicking on the pages listed below, or by using the keyword search tool below to find specific information within the annual report.-
 1
1 -
2
-
3
-
4
-
5
-
6
-
7
-
8
-
9
-
10
-
11
-
12
-
13
-
14
-
15
-
16
-
17
-
18
-
19
-
20
-
21
-
22
-
23
-
24
-
25
-
26
-
27
-
28
-
29
-
30
-
31
-
32
-
33
-
34
-
35
-
36
-
37
-
38
-
39
-
40
-
41
-
42
-
43
-
44
-
45
-
46
-
47
-
48
-
49
-
50
-
51
-
52
-
53
-
54
-
55
-
56
-
 57
57 -
 58
58 -
 59
59 -
 60
60 -
 61
61 -
 62
62 -
 63
63 -
 64
64 -
 65
65 -
 66
66 -
 67
67 -
 68
68 -
 69
69 -
 70
70 -
 71
71 -
 72
72 -
 73
73 -
 74
74 -
 75
75 -
 76
76 -
 77
77 -
78
-
79
-
80
-
81
-
82
-
83
-
84
-
85
-
86
-
87
-
88
 |
 |

51
Fiscal 2013 Fiscal 2012 Fiscal 2011
Expected term 3 months 3 months 3 months
Expected volatility 11.6% 11.9% 12.6%
Annual dividend yield —% —% —%
Risk free interest rate —% 0.1% 0.1%
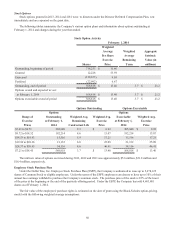
The weighted average per share fair value of purchase rights granted in 2013, 2012 and 2011 was $8.26, $6.97 and $5.22,
respectively. Total expense recognized for these purchase rights was $1.0 million in 2013 and $0.9 million in 2012 and 2011.
NOTE 10 – SALE OF INVESTMENT
On September 28, 2012, the Company sold its ownership interest in Ollie's Holdings, Inc., which it originally acquired in
2003. As a result of the sale, the Company recorded a pre-tax gain of $60.8 million in 2012 which is included in “Other
(income) expense, net” on the accompanying consolidated statements of operations. The gain, net of tax, was $38.1 million
and increased earnings per diluted share for 2012 by $0.16.
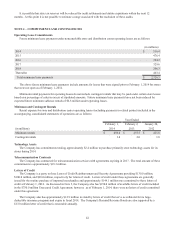
NOTE 11 - QUARTERLY FINANCIAL INFORMATION (Unaudited)
The following table sets forth certain items from the Company's unaudited consolidated statements of operations for each
quarter of fiscal year 2013 and 2012. The unaudited information has been prepared on the same basis as the audited
consolidated financial statements appearing elsewhere in this report and includes all adjustments, consisting only of normal
recurring adjustments, which management considers necessary for a fair presentation of the financial data shown. The
operating results for any quarter are not necessarily indicative of results for a full year or for any future period.
(dollars in millions, except diluted net income per share data)
First
Quarter (1)
Second
Quarter
Third
Quarter
Fourth
Quarter (2)
Fiscal 2013:
Net sales $ 1,865.8 $ 1,854.9 $ 1,884.7 $ 2,234.9
Gross profit $ 656.0 $ 648.7 $ 659.9 $ 825.2
Operating income $ 216.6 $ 201.3 $ 204.3 $ 348.2
Net income $ 133.5 $ 124.7 $ 125.4 $ 213.0
Diluted net income per share $ 0.59 $ 0.56 $ 0.58 $ 1.02
Stores open at end of quarter 4,763 4,842 4,953 4,992
Comparable store net sales change 2.1% 3.7% 3.1% 1.2%
Fiscal 2012:
Net sales $ 1,723.6 $ 1,704.6 $ 1,720.5 $ 2,245.8
Gross profit $ 602.7 $ 599.6 $ 599.6 $ 850.7
Operating income $ 188.0 $ 184.4 $ 184.2 $ 363.5
Net income $ 116.1 $ 119.2 $ 155.4 $ 228.6
Diluted net income per share $ 0.50 $ 0.51 $ 0.68 $ 1.01
Stores open at end of quarter 4,451 4,523 4,630 4,671
Comparable store net sales change 5.6% 4.5% 1.6% 2.4%
(1) Easter was observed on March 31, 2013 and April 8, 2012
(2) Fiscal 2013 contains 13 weeks ended February 1, 2014 while Fiscal 2012 contains 14 weeks ended February 2, 2013
Item 9. CHANGES IN AND DISAGREEMENTS WITH ACCOUNTANTS ON ACCOUNTING AND FINANCIAL
DISCLOSURE
None.