Dollar Tree 2013 Annual Report Download - page 46
Download and view the complete annual report
Please find page 46 of the 2013 Dollar Tree annual report below. You can navigate through the pages in the report by either clicking on the pages listed below, or by using the keyword search tool below to find specific information within the annual report.-
 1
1 -
2
-
3
-
4
-
5
-
6
-
7
-
8
-
9
-
10
-
11
-
12
-
13
-
14
-
15
-
16
-
17
-
18
-
19
-
20
-
21
-
22
-
23
-
24
-
25
-
26
-
27
-
28
-
29
-
30
-
31
-
32
-
33
-
34
-
35
-
 36
36 -
 37
37 -
 38
38 -
 39
39 -
 40
40 -
 41
41 -
 42
42 -
 43
43 -
 44
44 -
 45
45 -
 46
46 -
 47
47 -
 48
48 -
 49
49 -
 50
50 -
 51
51 -
 52
52 -
 53
53 -
 54
54 -
 55
55 -
 56
56 -
57
-
58
-
59
-
60
-
61
-
62
-
63
-
64
-
65
-
66
-
67
-
68
-
69
-
70
-
71
-
72
-
73
-
74
-
75
-
76
-
77
-
78
-
79
-
80
-
81
-
82
-
83
-
84
-
85
-
86
-
87
-
88
 |
 |

30
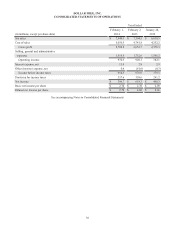
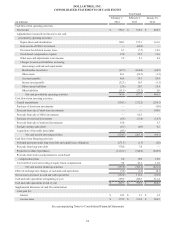
DOLLAR TREE, INC.
CONSOLIDATED STATEMENTS OF OPERATIONS
Year Ended
February 1, February 2, January 28,
(in millions, except per share data) 2014 2013 2012
Net sales $ 7,840.3 $ 7,394.5 $ 6,630.5
Cost of sales 5,050.5 4,741.8 4,252.2
Gross profit 2,789.8 2,652.7 2,378.3
Selling, general and administrative
expenses 1,819.5 1,732.6 1,596.2
Operating income 970.3 920.1 782.1
Interest expense, net 15.4 2.8 2.9
Other (income) expense, net 0.6 (61.6)(0.3)
Income before income taxes 954.3 978.9 779.5
Provision for income taxes 357.6 359.6 291.2
Net income $ 596.7 $ 619.3 $ 488.3
Basic net income per share $ 2.74 $ 2.70 $ 2.03
Diluted net income per share $ 2.72 $ 2.68 $ 2.01
See accompanying Notes to Consolidated Financial Statements