Dollar Tree 2013 Annual Report Download - page 34
Download and view the complete annual report
Please find page 34 of the 2013 Dollar Tree annual report below. You can navigate through the pages in the report by either clicking on the pages listed below, or by using the keyword search tool below to find specific information within the annual report.-
 1
1 -
2
-
3
-
4
-
5
-
6
-
7
-
8
-
9
-
10
-
11
-
12
-
13
-
14
-
15
-
16
-
17
-
18
-
19
-
20
-
21
-
22
-
23
-
 24
24 -
 25
25 -
 26
26 -
 27
27 -
 28
28 -
 29
29 -
 30
30 -
 31
31 -
 32
32 -
 33
33 -
 34
34 -
 35
35 -
 36
36 -
 37
37 -
 38
38 -
 39
39 -
 40
40 -
 41
41 -
 42
42 -
 43
43 -
 44
44 -
45
-
46
-
47
-
48
-
49
-
50
-
51
-
52
-
53
-
54
-
55
-
56
-
57
-
58
-
59
-
60
-
61
-
62
-
63
-
64
-
65
-
66
-
67
-
68
-
69
-
70
-
71
-
72
-
73
-
74
-
75
-
76
-
77
-
78
-
79
-
80
-
81
-
82
-
83
-
84
-
85
-
86
-
87
-
88
 |
 |

18
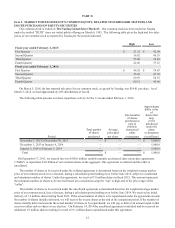
As of
February 1,
2014
February 2,
2013
January 28,
2012
January 29,
2011
January 30,
2010
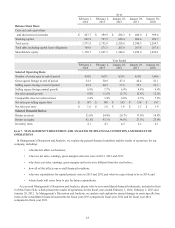
Balance Sheet Data:
Cash and cash equivalents
and short-term investments $ 267.7 $ 399.9 $ 288.3 $ 486.0 $ 599.4
Working capital 692.2 797.3 628.4 800.4 829.7
Total assets 2,771.9 2,752.0 2,328.6 2,380.5 2,289.7
Total debt, including capital lease obligations 769.8 271.3 265.8 267.8 267.8
Shareholders' equity 1,170.7 1,667.3 1,344.6 1,459.0 1,429.2
Year Ended
February 1,
2014
February 2,
2013
January 28,
2012
January 29,
2011
January 30,
2010
Selected Operating Data:
Number of stores open at end of period 4,992 4,671 4,351 4,101 3,806
Gross square footage at end of period 54.3 50.9 47.4 44.4 41.1
Selling square footage at end of period 43.2 40.5 37.6 35.1 32.3
Selling square footage annual growth 6.9% 7.7% 6.9% 8.8% 6.6%
Net sales annual growth 6.0% 11.5% 12.7% 12.4% 12.6%
Comparable store net sales increase 2.4% 3.4% 6.0% 6.3% 7.2%
Net sales per selling square foot $ 187 $ 190 $ 182 $ 174 $ 167
Net sales per store $ 1.6 $ 1.6 $ 1.6 $ 1.5 $ 1.4
Selected Financial Ratios:
Return on assets 21.6% 24.4% 20.7% 17.0% 14.8%
Return on equity 42.1% 41.1% 34.8% 27.5% 23.9%
Inventory turns 4.1 4.3 4.2 4.2 4.1
Item 7. MANAGEMENT’S DISCUSSION AND ANALYSIS OF FINANCIAL CONDITION AND RESULTS OF
OPERATIONS
In Management’s Discussion and Analysis, we explain the general financial condition and the results of operations for our
company, including:
• what factors affect our business;
• what our net sales, earnings, gross margins and costs were in 2013, 2012 and 2011;
• why those net sales, earnings, gross margins and costs were different from the year before;
• how all of this affects our overall financial condition;
• what our expenditures for capital projects were in 2013 and 2012 and what we expect them to be in 2014; and
• where funds will come from to pay for future expenditures.
As you read Management’s Discussion and Analysis, please refer to our consolidated financial statements, included in Item
8 of this Form 10-K, which present the results of operations for the fiscal years ended February 1, 2014, February 2, 2013 and
January 28, 2012. In Management’s Discussion and Analysis, we analyze and explain the annual changes in some specific line
items in the consolidated financial statements for fiscal year 2013 compared to fiscal year 2012 and for fiscal year 2012
compared to fiscal year 2011.