Dollar Tree 2013 Annual Report Download - page 50
Download and view the complete annual report
Please find page 50 of the 2013 Dollar Tree annual report below. You can navigate through the pages in the report by either clicking on the pages listed below, or by using the keyword search tool below to find specific information within the annual report.-
 1
1 -
2
-
3
-
4
-
5
-
6
-
7
-
8
-
9
-
10
-
11
-
12
-
13
-
14
-
15
-
16
-
17
-
18
-
19
-
20
-
21
-
22
-
23
-
24
-
25
-
26
-
27
-
28
-
29
-
30
-
31
-
32
-
33
-
34
-
35
-
36
-
37
-
38
-
39
-
 40
40 -
 41
41 -
 42
42 -
 43
43 -
 44
44 -
 45
45 -
 46
46 -
 47
47 -
 48
48 -
 49
49 -
 50
50 -
 51
51 -
 52
52 -
 53
53 -
 54
54 -
 55
55 -
 56
56 -
 57
57 -
 58
58 -
 59
59 -
 60
60 -
61
-
62
-
63
-
64
-
65
-
66
-
67
-
68
-
69
-
70
-
71
-
72
-
73
-
74
-
75
-
76
-
77
-
78
-
79
-
80
-
81
-
82
-
83
-
84
-
85
-
86
-
87
-
88
 |
 |
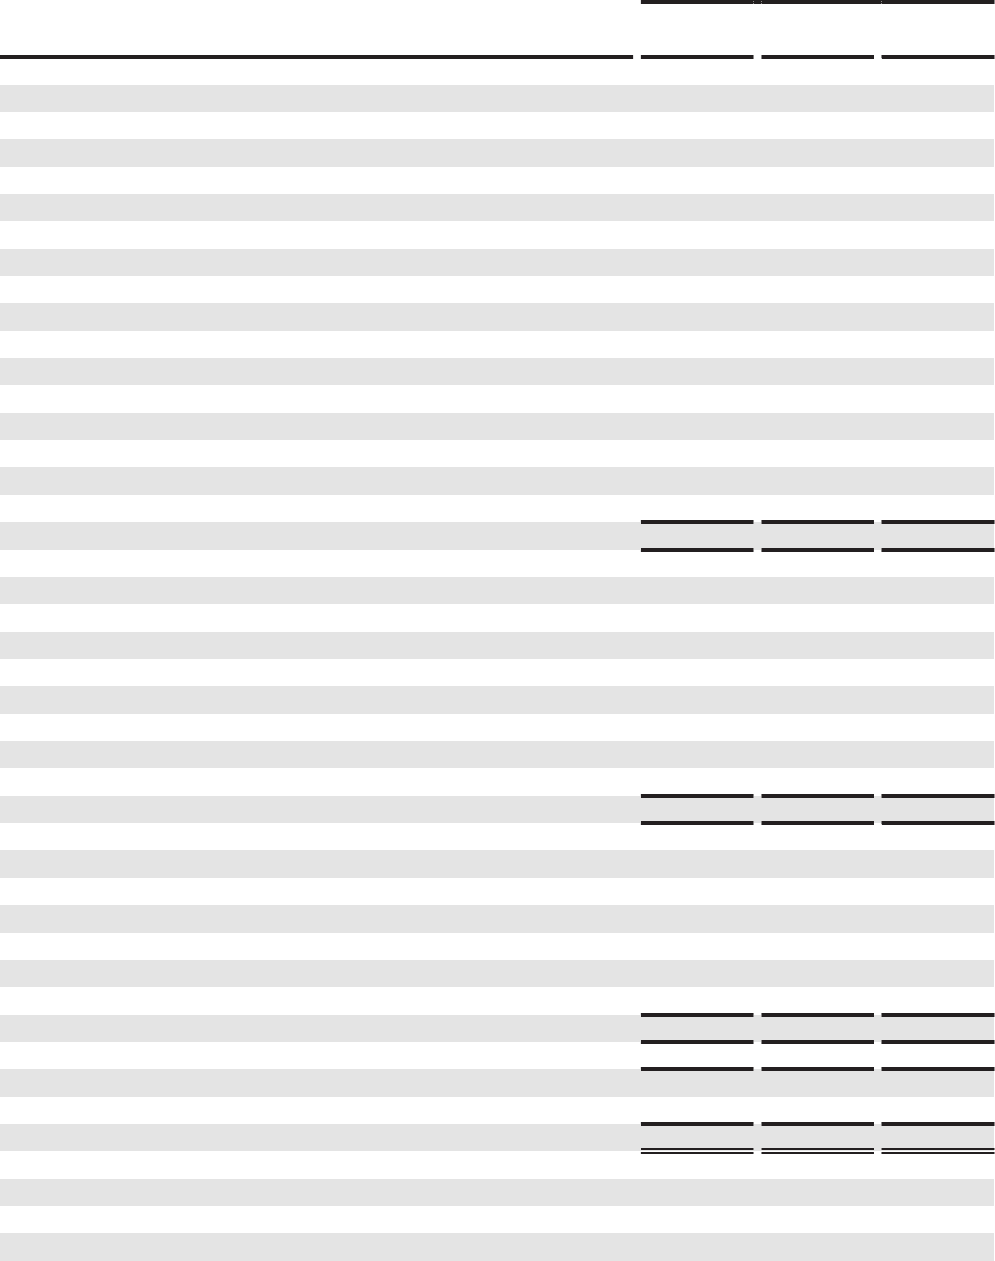
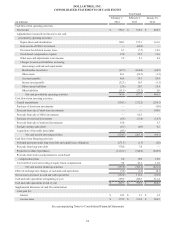
DOLLAR TREE, INC.
CONSOLIDATED STATEMENTS OF CASH FLOWS
34
Year Ended
February 1, February 2, January 28,
(in millions) 2014 2013 2012
Cash flows from operating activities:
Net income $ 596.7 $ 619.3 $ 488.3
Adjustments to reconcile net income to net cash
provided by operating activities:
Depreciation and amortization 190.5 175.3 163.9
Gain on sale of Ollie's investment — (60.8) —
Provision for deferred income taxes 6.7 (7.7) 10.9
Stock-based compensation expense 37.0 35.5 31.6
Other non-cash adjustments to net income 3.9 4.1 4.4
Changes in assets and liabilities increasing
(decreasing) cash and cash equivalents:
Merchandise inventories (67.7) (104.0) (64.5)
Other assets 26.1 (56.7) (1.3)
Accounts payable 46.9 59.3 26.9
Income taxes payable (32.3) 16.3 (1.1)
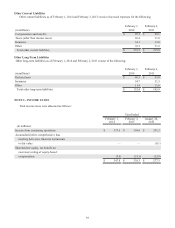
Other current liabilities (2.9) 20.3 25.4
Other liabilities (11.5) (23.2) 2.0
Net cash provided by operating activities 793.4 677.7 686.5
Cash flows from investing activities:
Capital expenditures (330.1) (312.2) (250.1)
Purchase of short-term investments — — (6.0)
Proceeds from sale of short-term investments — — 180.8
Proceeds from sale of Ollie's investment — 62.3 —
Purchase of restricted investments (8.8) (11.0) (16.3)
Proceeds from sale of restricted investments 15.0 — 5.3
Foreign currency gain (loss) (0.1) (0.4) 0.2
Acquisition of favorable lease rights (0.3) — —
Net cash used in investing activities (324.3) (261.3) (86.1)
Cash flows from financing activities:
Principal payments under long-term debt and capital lease obligations (271.5) (1.5) (2.0)
Proceeds from long-term debt 770.0 7.0 —
Payments for share repurchases (1,112.1) (340.2) (645.9)
Proceeds from stock issued pursuant to stock-based
compensation plans 6.0 10.0 10.9
Tax benefit of exercises/vesting of equity based compensation 9.8 21.3 13.8
Net cash used in financing activities (597.8) (303.4) (623.2)
Effect of exchange rate changes on cash and cash equivalents (3.5) (1.4) (0.1)
Net increase (decrease) in cash and cash equivalents (132.2) 111.6 (22.9)
Cash and cash equivalents at beginning of year 399.9 288.3 311.2
Cash and cash equivalents at end of year $ 267.7 $ 399.9 $ 288.3
Supplemental disclosure of cash flow information:
Cash paid for:
Interest $ 14.5 $ 3.3 $ 3.2
Income taxes $ 373.2 $ 333.9 $ 268.3
See accompanying Notes to Consolidated Financial Statements