Dollar Tree 2013 Annual Report Download - page 35
Download and view the complete annual report
Please find page 35 of the 2013 Dollar Tree annual report below. You can navigate through the pages in the report by either clicking on the pages listed below, or by using the keyword search tool below to find specific information within the annual report.-
 1
1 -
2
-
3
-
4
-
5
-
6
-
7
-
8
-
9
-
10
-
11
-
12
-
13
-
14
-
15
-
16
-
17
-
18
-
19
-
20
-
21
-
22
-
23
-
24
-
 25
25 -
 26
26 -
 27
27 -
 28
28 -
 29
29 -
 30
30 -
 31
31 -
 32
32 -
 33
33 -
 34
34 -
 35
35 -
 36
36 -
 37
37 -
 38
38 -
 39
39 -
 40
40 -
 41
41 -
 42
42 -
 43
43 -
 44
44 -
 45
45 -
46
-
47
-
48
-
49
-
50
-
51
-
52
-
53
-
54
-
55
-
56
-
57
-
58
-
59
-
60
-
61
-
62
-
63
-
64
-
65
-
66
-
67
-
68
-
69
-
70
-
71
-
72
-
73
-
74
-
75
-
76
-
77
-
78
-
79
-
80
-
81
-
82
-
83
-
84
-
85
-
86
-
87
-
88
 |
 |
19
Key Events and Recent Developments
Several key events have had or are expected to have a significant effect on our operations. You should keep in mind that:
• On September 17, 2013, we entered into agreements with JP Morgan Chase Bank to repurchase $1.0 billion of our
common stock under a variable maturity accelerated share repurchase program, 50% of which is collared and 50%
of which is uncollared.
• On September 16, 2013, we completed a private placement with institutional investors of $750 million aggregate
principal amount of Senior Notes. The Senior Notes include three tranches with $300 million of 4.03% Senior
Notes due in September 2020, $350 million of 4.63% Senior Notes due in September 2023 and $100 million of
4.78% Senior Notes due in September 2025.
• On September 13, 2013, our Board of Directors authorized the repurchase of an additional $2.0 billion of our
common stock. This authorization replaced all previous authorizations. At February 1, 2014, we had $1.0 billion
remaining under Board repurchase authorization.
• In August 2013, we completed a 401,000 square foot expansion of our distribution center in Marietta, Oklahoma.
The Marietta distribution center is now a 1,004,000 square foot, fully automated facility.
• In June 2013, we completed construction on a new 1.0 million square foot distribution center in Windsor,
Connecticut.
• In March 2013, we leased an additional 0.4 million square feet at our distribution center in San Bernardino,
California. The San Bernardino distribution center is now an 802,000 square foot facility.
• On June 6, 2012, we entered into a five-year $750.0 million Unsecured Credit Agreement which provides for a
$750.0 million revolving line of credit, including up to $150.0 million in available letters of credit. The interest
rate on the facility is based, at our option, on a LIBOR rate, plus a margin, or an alternate base rate, plus a margin.
• In October 2011, we completed a 410,000 square foot expansion of our distribution center in Savannah,
Georgia. The Savannah distribution center is now a 1,014,000 square foot, fully automated facility.
Overview
Our net sales are derived from the sale of merchandise. Two major factors tend to affect our net sales trends. First is our
success at opening new stores or adding new stores through acquisitions. Second, sales vary at our existing stores from one
year to the next. We refer to this change as a change in comparable store net sales, because we compare only those stores that
are open throughout both of the periods being compared. We include sales from stores expanded during the year in the
calculation of comparable store net sales, which has the effect of increasing our comparable store net sales. The term
'expanded' also includes stores that are relocated.
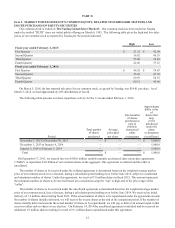
At February 1, 2014, we operated 4,992 stores in 48 states and the District of Columbia, and five Canadian provinces, with
43.2 million selling square feet compared to 4,671 stores with 40.5 million selling square feet at February 2, 2013. During
fiscal 2013, we opened 343 stores, expanded 71 stores and closed 22 stores, compared to 345 new stores opened, 87 stores
expanded and 25 stores closed during fiscal 2012. In the current year we increased our selling square footage by 6.9%. Of the
2.7 million selling square foot increase in 2013, 0.2 million was added by expanding existing stores. The average size of our
stores opened in 2013 was approximately 8,020 selling square feet (or about 9,800 gross square feet). For 2014, we continue to
plan to open stores that are approximately 8,000 - 10,000 selling square feet (or about 10,000 - 12,000 gross square feet). We
believe that this store size is our optimal size operationally and that this size also gives our customers an ideal shopping
environment that invites them to shop longer and buy more.
Fiscal 2013 and Fiscal 2011 which ended on February 1, 2014, and January 28, 2012, respectively, each included 52
weeks. Fiscal 2012 ended on February 2, 2013 and included 53 weeks, commensurate with the retail calendar. The 53rd week
in 2012 added approximately $125 million in sales.
In fiscal 2013, comparable store net sales increased by 2.4%. This increase was based on the comparable 52 weeks for
both years. The comparable store net sales increase was the result of a 1.9% increase in the number of transactions and a 0.5%
increase in average ticket. We believe comparable store net sales continued to be positively affected by a number of our
initiatives, as debit and credit card penetration continued to increase in 2013, and we continued the roll-out of frozen and
refrigerated merchandise to more of our stores. At February 1, 2014 we had frozen and refrigerated merchandise in
approximately 3,160 stores compared to approximately 2,550 stores at February 2, 2013. We believe that the addition of frozen
and refrigerated product enables us to increase sales and earnings by increasing the number of shopping trips made by our
customers. In addition, we accept food stamps (under the Supplemental Nutrition Assistance Program (“SNAP”)) in
approximately 4,620 qualified stores compared to 4,200 at the end of 2012. SNAP benefits were lowered for recipients after
November 1, 2013; however, we do not expect the effect on our sales to be material.