Dollar Tree 2013 Annual Report Download - page 31
Download and view the complete annual report
Please find page 31 of the 2013 Dollar Tree annual report below. You can navigate through the pages in the report by either clicking on the pages listed below, or by using the keyword search tool below to find specific information within the annual report.
15
PART II
Item 5. MARKET FOR REGISTRANT'S COMMON EQUITY, RELATED STOCKHOLDER MATTERS AND
ISSUER PURCHASES OF EQUITY SECURITIES
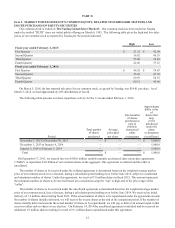
Our common stock is traded on The Nasdaq Global Select Market®. Our common stock has been traded on Nasdaq
under the symbol "DLTR" since our initial public offering on March 6, 1995. The following table gives the high and low sales
prices of our common stock as reported by Nasdaq for the periods indicated.
High Low
Fiscal year ended February 2, 2013:
First Quarter $ 51.21 $ 42.04
Second Quarter 56.82 46.35
Third Quarter 53.00 38.40
Fourth Quarter 42.66 37.12
Fiscal year ended February 1, 2014:
First Quarter $ 48.92 $ 38.43
Second Quarter 55.02 47.70
Third Quarter 60.19 50.33
Fourth Quarter 60.11 49.66
On March 5, 2014, the last reported sale price for our common stock, as quoted by Nasdaq, was $54.01 per share. As of
March 5, 2014, we had approximately 268 shareholders of record.
The following table presents our share repurchase activity for the 13 weeks ended February 1, 2014:
Total number
of shares
Average
price paid
Total number
of shares
purchased as
part of
publicly
announced
plans
Approximate
dollar value
of
shares that
may
yet be
purchased
under the
plans
or programs
Period purchased per share or programs (in millions)
November 3, 2013 to November 30, 2013 — $ — — $ 1,000.0
December 1, 2013 to January 4, 2014 — — — 1,000.0
January 5, 2014 to February 1, 2014 — — — 1,000.0
Total — $ — — $ 1,000.0
On September 17, 2013, we entered into two $500.0 million variable maturity accelerated share repurchase agreements
("ASRs") to repurchase $1.0 billion of our common shares in the aggregate. One agreement is collared and the other is
uncollared.
The number of shares to be received under the collared agreement is determined based on the weighted average market
price of our common stock, less a discount, during a calculation period ending on or before June 2014, subject to a minimum
and maximum number of shares. Under this agreement, we received 7.8 million shares in fiscal 2013. This amount represents
the minimum number of shares to be received based on a calculation using the "cap" or high-end of the price range of the
"collar".
The number of shares to be received under the uncollared agreement is determined based on the weighted average market
price of our common stock, less a discount, during a calculation period ending on or before June 2014. We received an initial
delivery of 7.2 million shares during fiscal 2013. If the actual number of shares to be repurchased under the agreement exceeds
the number of shares initially delivered, we will receive the excess shares at the end of the calculation period. If the number of
shares initially delivered exceeds the actual number of shares to be repurchased, we will pay or deliver an amount equal to that
excess in either cash or shares at our election. On February 14, 2014 the uncollared agreement concluded and we received an
additional 1.9 million shares resulting in a total of 9.1 million shares repurchased under this agreement.


