Dollar Tree 2013 Annual Report Download - page 66
Download and view the complete annual report
Please find page 66 of the 2013 Dollar Tree annual report below. You can navigate through the pages in the report by either clicking on the pages listed below, or by using the keyword search tool below to find specific information within the annual report.-
 1
1 -
2
-
3
-
4
-
5
-
6
-
7
-
8
-
9
-
10
-
11
-
12
-
13
-
14
-
15
-
16
-
17
-
18
-
19
-
20
-
21
-
22
-
23
-
24
-
25
-
26
-
27
-
28
-
29
-
30
-
31
-
32
-
33
-
34
-
35
-
36
-
37
-
38
-
39
-
40
-
41
-
42
-
43
-
44
-
45
-
46
-
47
-
48
-
49
-
50
-
51
-
52
-
53
-
54
-
55
-
 56
56 -
 57
57 -
 58
58 -
 59
59 -
 60
60 -
 61
61 -
 62
62 -
 63
63 -
 64
64 -
 65
65 -
 66
66 -
 67
67 -
 68
68 -
 69
69 -
 70
70 -
 71
71 -
 72
72 -
 73
73 -
 74
74 -
 75
75 -
 76
76 -
77
-
78
-
79
-
80
-
81
-
82
-
83
-
84
-
85
-
86
-
87
-
88
 |
 |

50
Stock Options
Stock options granted in 2013, 2012 and 2011 were to directors under the Director Deferred Compensation Plan, vest
immediately and are expensed on the grant date.
The following tables summarize the Company's various option plans and information about options outstanding at
February 1, 2014 and changes during the year then ended.
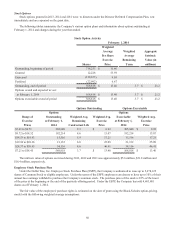
Stock Option Activity
February 1, 2014
Weighted
Average Weighted Aggregate
Per Share Average Intrinsic
Exercise Remaining Value (in
Shares Price Term millions)
Outstanding, beginning of period 718,255 $ 11.66
Granted 12,228 53.59
Exercised (138,673) 9.05
Forfeited (22,992) 6.67
Outstanding, end of period 568,818 $ 13.40 3.7 $ 21.2
Options vested and expected to vest
at February 1, 2014 568,818 $ 13.40 3.7 $ 21.2
Options exercisable at end of period 568,818 $ 13.40 3.7 $ 21.2
Options Outstanding Options Exercisable
Options Options
Range of Outstanding Weighted Avg. Weighted Avg. Exercisable Weighted Avg.
Exercise at February 1, Remaining Exercise at February 1, Exercise
Prices 2014 Contractual Life Price 2014 Price
$7.21 to $9.71 305,840 2.3 $ 8.92 305,840 $ 8.92
$9.72 to $14.52 192,214 4.6 13.07 192,214 13.07
$14.53 to $19.93 15,516 5.9 17.21 15,516 17.21
$19.94 to $28.36 21,132 6.8 25.09 21,132 25.09
$28.37 to $58.45 34,116 8.6 46.41 34,116 46.41
$7.21 to $58.45 568,818 3.7 $ 13.40 568,818 $ 13.40
The intrinsic value of options exercised during 2013, 2012 and 2011 was approximately $5.6 million, $21.8 million and
$16.4 million, respectively.
Employee Stock Purchase Plan
Under the Dollar Tree, Inc. Employee Stock Purchase Plan (ESPP), the Company is authorized to issue up to 5,278,125
shares of Common Stock to eligible employees. Under the terms of the ESPP, employees can choose to have up to 10% of their
annual base earnings withheld to purchase the Company's common stock. The purchase price of the stock is 85% of the lower
of the price at the beginning or the end of the quarterly offering period. Under the ESPP, the Company has sold 4,683,801
shares as of February 1, 2014.
The fair value of the employees' purchase rights is estimated on the date of grant using the Black-Scholes option-pricing
model with the following weighted average assumptions: