Dollar Tree 2013 Annual Report Download - page 3
Download and view the complete annual report
Please find page 3 of the 2013 Dollar Tree annual report below. You can navigate through the pages in the report by either clicking on the pages listed below, or by using the keyword search tool below to find specific information within the annual report.-
 1
1 -
 2
2 -
 3
3 -
 4
4 -
 5
5 -
 6
6 -
 7
7 -
 8
8 -
 9
9 -
 10
10 -
 11
11 -
 12
12 -
 13
13 -
 14
14 -
15
-
16
-
17
-
18
-
19
-
20
-
21
-
22
-
23
-
24
-
25
-
26
-
27
-
28
-
29
-
30
-
31
-
32
-
33
-
34
-
35
-
36
-
37
-
38
-
39
-
40
-
41
-
42
-
43
-
44
-
45
-
46
-
47
-
48
-
49
-
50
-
51
-
52
-
53
-
54
-
55
-
56
-
57
-
58
-
59
-
60
-
61
-
62
-
63
-
64
-
65
-
66
-
67
-
68
-
69
-
70
-
71
-
72
-
73
-
74
-
75
-
76
-
77
-
78
-
79
-
80
-
81
-
82
-
83
-
84
-
85
-
86
-
87
-
88
 |
 |

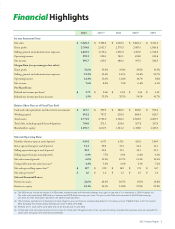
(a) The 2012 results include the impact of a 53rd week, commensurate with the retail calendar, and a gain on the sale of our investment in Ollie’s Holdings, Inc.
The extra week contributed $125 million of revenue and $0.08 diluted earnings per share. The gain on the Ollie’s sale amounted to $0.16 diluted earnings
per share. All other fiscal years reported in the table contain 52 weeks.
(b)
The Company recorded a non-recurring, non-cash charge to gross profit and a corresponding reduction in inventory, at cost, of $26.3 million in the first quarter
2010. Excluding this charge, diluted earnings per share in 2010 were $1.62.
(c) Reflects 2 for 1 stock split in June 2012 and a 3 for 2 stock split in June 2010.
(d) Comparable store net sales compare net store sales for stores open throughout each of the two periods being compared. Net sales per store are calculated for
stores open throughout the entire period presented.
2013 Annual Report 1
Financial Highlights
2013 2012 (a) 2011 2010(b) 2009
Income Statement Data:
Net sales $ 7,840.3 $ 7,394.5 $ 6,630.5 $ 5,882.4 $ 5,231.2
Gross profit 2,789.8 2,652.7 2,378.3 2,087.6 1,856.8
Selling, general and administrative expenses 1,819.5 1,732.6 1,596.2 1,457.6 1,344.0
Operating income 970.3 920.1 782.1 630.0 512.8
Net income 596.7 619.3 488.3 397.3 320.5
Margin Data (as a percentage of net sales):
Gross profit 35.6% 35.9% 35.9% 35.5% 35.5%
Selling, general and administrative expenses 23.2% 23.5% 24.1% 24.8% 25.7%
Operating income 12.4% 12.4% 11.8% 10.7% 9.8%
Net income 7.6% 8.4% 7.4% 6.8% 6.1%
Per Share Data:
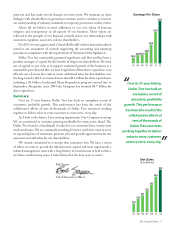
Diluted net income per share(c) $ 2.72 $ 2.68 $ 2.01 $ 1.55 $ 1.19
Diluted net income per share increase 1.5% 33.3% 29.7% 30.3% 41.7%
Balance Sheet Data as of Fiscal Year End:
Cash and cash equivalents and short-term investments $ 267.7 $ 399.9 $ 288.3 $ 486.0 $ 599.4
Working capital 692.2 797.3 628.4 800.4 829.7
Tota l asse t s 2,771.9 2,752.0 2,328.6 2,380.5 2,289.7
Total debt, including capital lease obligations 769.8 271.3 265.8 267.8 267.8
Shareholders’ equity 1,170.7 1,667.3 1,344.6 1,459.0 1,429.2
Selected Operating Data:
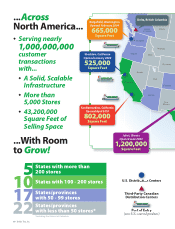
Number of stores open at end of period 4,992 4,671 4,351 4,101 3,806
Gross square footage at end of period 54.3 50.9 47.4 44.4 41.1
Selling square footage at end of period 43.2 40.5 37.6 35.1 32.3
Selling square footage annual growth 6.9% 7.7% 6.9% 8.8% 6.6%
Net sales annual growth 6.0% 11.5% 12.7% 12.4% 12.6%
Comparable store net sales increase(d) 2.4% 3.4% 6.0% 6.3% 7.2%
Net sales per selling square foot(d) $ 187 $ 190 $ 182 $ 174 $ 167
Net sales per store(d) $ 1.6 $ 1.6 $ 1.6 $ 1.5 $ 1.4
Selected Financial Ratios:
Return on assets 21.6% 24.4% 20.7% 17.0% 14.8%
Return on equity 42.1% 41.1% 34.8% 27.5% 23.9%