Dollar Tree 2013 Annual Report Download - page 36
Download and view the complete annual report
Please find page 36 of the 2013 Dollar Tree annual report below. You can navigate through the pages in the report by either clicking on the pages listed below, or by using the keyword search tool below to find specific information within the annual report.-
 1
1 -
2
-
3
-
4
-
5
-
6
-
7
-
8
-
9
-
10
-
11
-
12
-
13
-
14
-
15
-
16
-
17
-
18
-
19
-
20
-
21
-
22
-
23
-
24
-
25
-
 26
26 -
 27
27 -
 28
28 -
 29
29 -
 30
30 -
 31
31 -
 32
32 -
 33
33 -
 34
34 -
 35
35 -
 36
36 -
 37
37 -
 38
38 -
 39
39 -
 40
40 -
 41
41 -
 42
42 -
 43
43 -
 44
44 -
 45
45 -
 46
46 -
47
-
48
-
49
-
50
-
51
-
52
-
53
-
54
-
55
-
56
-
57
-
58
-
59
-
60
-
61
-
62
-
63
-
64
-
65
-
66
-
67
-
68
-
69
-
70
-
71
-
72
-
73
-
74
-
75
-
76
-
77
-
78
-
79
-
80
-
81
-
82
-
83
-
84
-
85
-
86
-
87
-
88
 |
 |

20
Our point-of-sale technology provides us with valuable sales and inventory information to assist our buyers and improve
our merchandise allocation to our stores. We believe that this has enabled us to better manage our inventory flow resulting in
more efficient distribution and store operations.
We must continue to control our merchandise costs, inventory levels and our general and administrative expenses as
increases in these line items could negatively impact our operating results.
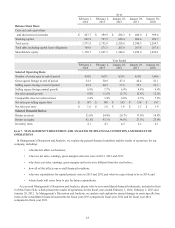
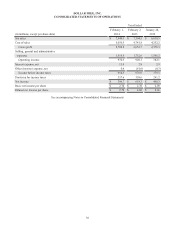
Results of Operations
Year Ended
February 1,
2014
February 2,
2013
January 28,
2012
Net sales 100.0% 100.0 % 100.0%
Cost of sales 64.4% 64.1 % 64.1%
Gross profit 35.6% 35.9 % 35.9%
Selling, general and administrative expenses 23.2% 23.5 % 24.1%
Operating income 12.4% 12.4 % 11.8%
Interest expense,net 0.2% — % —%
Other (income) expense, net —% (0.8)% —
Income before income taxes 12.2% 13.2 % 11.8%
Provision for income taxes 4.6% 4.8 % 4.4%
Net income 7.6% 8.4 % 7.4%
Fiscal year ended February 1, 2014 compared to fiscal year ended February 2, 2013
Net sales. Net sales increased 6.0%, or $445.8 million, in 2013 compared to 2012, resulting from sales in our new stores
and a 2.4% increase in comparable store net sales. Excluding the 53rd week in 2012, which accounted for approximately
$125.0 million of sales, net sales increased 7.9%, or $570.8 million. The comparable store net sales increase is based on the
comparable 52 weeks for both years. Comparable store net sales are positively affected by our expanded and relocated stores,
which we include in the calculation, and, to a lesser extent, are negatively affected when we open new stores or expand stores
near existing ones.
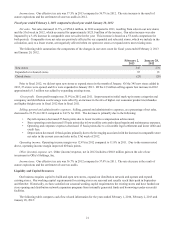
The following table summarizes the components of the changes in our store count for fiscal years ended February 1, 2014
and February 2, 2013.
February 1,
2014
February 2,
2013
New stores 343 345
Expanded or relocated stores 71 87
Closed stores (22)(25)
Of the 2.7 million selling square foot increase in 2013 approximately 0.2 million was added by expanding existing stores.
Gross profit. Gross profit margin was 35.6% in 2013 compared to 35.9% in 2012 due to loss of leverage in occupancy and
distribution cost from the 53rd week of sales in 2012.
Selling, general and administrative expenses. Selling, general and administrative expenses, as a percentage of net sales,
decreased to 23.2% for 2013 compared to 23.5% for 2012. The decrease is primarily due to lower incentive compensation
achievement in 2013 compared with 2012 and lower inventory service fees.
Operating income. Operating income margin was 12.4% in 2013 and 2012 due to the reasons noted above.
Interest expense, net. Interest expense, net increased $12.9 million due to interest related to the $750.0 million of senior
notes issued in September 2013.
Other (income) expense, net. Other (income) expense, net in 2012 includes a $60.8 million gain on the sale of our
investment in Ollie's Holdings, Inc.