Dollar Tree 2013 Annual Report Download - page 51
Download and view the complete annual report
Please find page 51 of the 2013 Dollar Tree annual report below. You can navigate through the pages in the report by either clicking on the pages listed below, or by using the keyword search tool below to find specific information within the annual report.35
DOLLAR TREE, INC.
NOTES TO CONSOLIDATED FINANCIAL STATEMENTS
NOTE 1 - SUMMARY OF SIGNIFICANT ACCOUNTING POLICIES
Description of Business
Dollar Tree, Inc. (the Company) is the leading operator of discount variety retail stores offering merchandise at the fixed
price of $1.00 or less with 4,992 discount variety retail stores in the United States and Canada at February 1, 2014. Below are
those accounting policies considered by the Company to be significant.
Principles of Consolidation
The consolidated financial statements include the financial statements of Dollar Tree, Inc., and its wholly owned
subsidiaries. All significant intercompany balances and transactions have been eliminated in consolidation.
Foreign Currency
The functional currencies of the Company’s international subsidiaries are primarily the local currencies of the countries in
which the subsidiaries are located. Foreign currency denominated assets and liabilities are translated into U.S. dollars using the
exchange rates in effect at the consolidated balance sheet date. Results of operations and cash flows are translated using the
average exchange rates throughout the period. The effect of exchange rate fluctuations on translation of assets and liabilities is
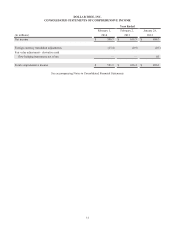
included as a component of shareholders’ equity in accumulated other comprehensive income (loss). Gains and losses from
foreign currency transactions, which are included in non-operating income (expense), have not been significant.
Stock Dividend
On May 29, 2012, the Company's Board of Directors approved a 2-for-1 stock split in the form of a 100% common stock
dividend. New shares were distributed on June 26, 2012 to shareholders of record as of the close of business on June 12, 2012.
Segment Information
The Company's retail stores represent a single operating segment based on the way the Company manages its
business. Operating decisions are made at the Company level in order to maintain a consistent retail store presentation. The
Company’s retail stores sell similar products and services, use similar processes to sell those products and services, and sell
their products and services to similar classes of customers. The amounts of long-lived assets and net sales outside of the U.S.
were not significant for any of the periods presented.
Fiscal Year
The Company's fiscal year ends on the Saturday closest to January 31. Any reference herein to "2013" or "Fiscal 2013,"
“2012” or “Fiscal 2012,” and “2011” or “Fiscal 2011,” relates to as of or for the years ended February 1, 2014, February 2,
2013, and January 28, 2012, respectively. Fiscal 2012 ended on February 2, 2013 and included 53 weeks, commensurate with
the retail calendar. Fiscal 2013 and 2011 each included 52 weeks.
Use of Estimates
The preparation of financial statements in conformity with U.S. generally accepted accounting principles requires
management to make estimates and assumptions that affect the reported amounts of assets and liabilities and disclosures of
contingent assets and liabilities at the date of the consolidated financial statements and the reported amounts of revenues and
expenses during the reporting period. Actual results could differ from those estimates.
Cash and Cash Equivalents
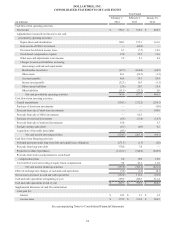
Cash and cash equivalents at February 1, 2014 and February 2, 2013 includes $172.6 million and $344.5 million,
respectively, of investments primarily in money market securities which are valued at cost, which approximates fair value. For
purposes of the consolidated statements of cash flows, the Company considers all highly liquid debt instruments with original
maturities of 3 months or less to be cash equivalents. The majority of payments due from financial institutions for the
settlement of debit card and credit card transactions process within 3 business days, and therefore are classified as cash and
cash equivalents.
Merchandise Inventories
Merchandise inventories at the Company’s distribution centers are stated at the lower of cost or market, determined on a
weighted-average cost basis. Cost is assigned to store inventories using the retail inventory method on a weighted-average
basis. Under the retail inventory method, the valuation of inventories at cost and the resulting gross margins are computed by
applying a calculated cost-to-retail ratio to the retail value of inventories.


