Dollar Tree 2013 Annual Report Download - page 21
Download and view the complete annual report
Please find page 21 of the 2013 Dollar Tree annual report below. You can navigate through the pages in the report by either clicking on the pages listed below, or by using the keyword search tool below to find specific information within the annual report.-
 1
1 -
2
-
3
-
4
-
5
-
6
-
7
-
8
-
9
-
10
-
 11
11 -
 12
12 -
 13
13 -
 14
14 -
 15
15 -
 16
16 -
 17
17 -
 18
18 -
 19
19 -
 20
20 -
 21
21 -
 22
22 -
 23
23 -
 24
24 -
 25
25 -
 26
26 -
 27
27 -
 28
28 -
 29
29 -
 30
30 -
 31
31 -
32
-
33
-
34
-
35
-
36
-
37
-
38
-
39
-
40
-
41
-
42
-
43
-
44
-
45
-
46
-
47
-
48
-
49
-
50
-
51
-
52
-
53
-
54
-
55
-
56
-
57
-
58
-
59
-
60
-
61
-
62
-
63
-
64
-
65
-
66
-
67
-
68
-
69
-
70
-
71
-
72
-
73
-
74
-
75
-
76
-
77
-
78
-
79
-
80
-
81
-
82
-
83
-
84
-
85
-
86
-
87
-
88
 |
 |

5
PART I
Item 1. BUSINESS
Overview
We are the leading operator of discount variety stores offering merchandise at the fixed price of $1.00. We believe the
variety and value of products we sell for $1.00 sets us apart from our competitors. At February 1, 2014, we operated 4,992
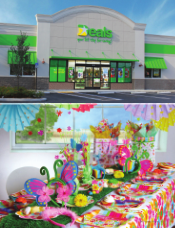
discount variety retail stores. Our stores operate under the names of Dollar Tree, Deal$, Dollar Tree Deal$, Dollar Tree
Canada, Dollar Giant and Dollar Bills. In 4,778 of these stores, we sell substantially all items for $1.00 or less in the United
States and $1.25(CAD) or less in Canada. In substantially all of the remaining stores, operating as Deal$, we sell items for
$1.00 or less but also sell items for more than $1.00.
We believe our optimal store size is between 8,000 and 10,000 selling square feet. This store size provides the appropriate
amount of space for our broad merchandise offerings while allowing us to provide ease of shopping to our customers. As we
have been expanding our merchandise offerings, we have added freezers and coolers to approximately 3,160 stores to increase
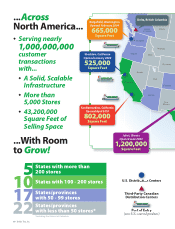
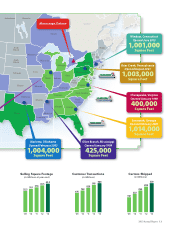
sales and shopping frequency. At January 30, 2010, we operated 3,806 stores in 48 states. At February 1, 2014, we operated
4,812 stores in 48 states and the District of Columbia, as well as 180 stores in Canada. Our revenue and assets in Canada are
not material. Our selling square footage increased from approximately 32.3 million square feet in January 2010 to 43.2 million
square feet in February 2014. Our store growth has resulted primarily from opening new stores and the acquisition of Dollar
Giant.
Business Strategy
Value Merchandise Offering. We strive to exceed our customers' expectations of the variety and quality of products that
they can purchase for $1.00 by offering items that we believe typically sell for higher prices elsewhere. We buy approximately
58% to 60% of our merchandise domestically and import the remaining 40% to 42%. Our domestic purchases include basic,
seasonal, closeouts and promotional merchandise. We believe our mix of imported and domestic merchandise affords our
buyers flexibility that allows them to consistently exceed the customer's expectations. In addition, direct relationships with
manufacturers permit us to select from a broad range of products and customize packaging, product sizes and package
quantities that meet our customers' needs.
Mix of Basic Variety and Seasonal Merchandise. We maintain a balanced selection of products within traditional variety
store categories. We offer a wide selection of everyday basic products and we supplement these basic, everyday items with
seasonal, closeout and promotional merchandise. We attempt to keep certain basic consumable merchandise in our stores
continuously to establish our stores as a destination and we have slightly increased the mix of consumable merchandise in order
to increase the traffic in our stores. Closeout and promotional merchandise is purchased opportunistically and represents less
than 10% of our purchases.
Our merchandise mix consists of:
• consumable merchandise, which includes candy and food, health and beauty care, and everyday consumables such as
paper and chemicals, and in select stores, frozen and refrigerated food;
• variety merchandise, which includes toys, durable housewares, gifts, party goods, greeting cards, softlines, and other
items; and
• seasonal goods, which include, among others, Valentine's Day, Easter, Halloween and Christmas merchandise.
We have added freezers and coolers to certain stores and increased the amount of consumable merchandise carried by those
stores. We believe this initiative helps drive additional transactions and allows us to appeal to a broader demographic mix. We
have added freezers and coolers to 610 additional stores in 2013. Therefore, as of February 1, 2014, we have freezers and
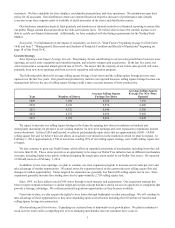
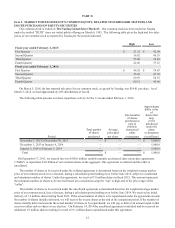
coolers in 3,160 of our stores. We plan to add them to 320 more stores in 2014. The following table shows the percentage of
net sales of each major product group for the years ended February 1, 2014 and February 2, 2013:
February 1, February 2,
Merchandise Type 2014 2013
Consumable 49.4% 49.9%
Variety categories 46.3% 45.8%
Seasonal 4.3% 4.3%