Dollar Tree 2013 Annual Report Download - page 37
Download and view the complete annual report
Please find page 37 of the 2013 Dollar Tree annual report below. You can navigate through the pages in the report by either clicking on the pages listed below, or by using the keyword search tool below to find specific information within the annual report.-
 1
1 -
2
-
3
-
4
-
5
-
6
-
7
-
8
-
9
-
10
-
11
-
12
-
13
-
14
-
15
-
16
-
17
-
18
-
19
-
20
-
21
-
22
-
23
-
24
-
25
-
26
-
 27
27 -
 28
28 -
 29
29 -
 30
30 -
 31
31 -
 32
32 -
 33
33 -
 34
34 -
 35
35 -
 36
36 -
 37
37 -
 38
38 -
 39
39 -
 40
40 -
 41
41 -
 42
42 -
 43
43 -
 44
44 -
 45
45 -
 46
46 -
 47
47 -
48
-
49
-
50
-
51
-
52
-
53
-
54
-
55
-
56
-
57
-
58
-
59
-
60
-
61
-
62
-
63
-
64
-
65
-
66
-
67
-
68
-
69
-
70
-
71
-
72
-
73
-
74
-
75
-
76
-
77
-
78
-
79
-
80
-
81
-
82
-
83
-
84
-
85
-
86
-
87
-
88
 |
 |

21
Income taxes. Our effective tax rate was 37.5% in 2013 compared to 36.7% in 2012. The rate increase is the result of
statute expirations and the settlement of state tax audits in 2012.
Fiscal year ended February 2, 2013 compared to fiscal year ended January 28, 2012
Net sales. Net sales increased 11.5%, or $764.0 million, in 2012 compared to 2011, resulting from sales in our new stores
and the 53rd week in 2012, which accounted for approximately $125.0 million of the increase. Our sales increase was also
impacted by a 3.4% increase in comparable store net sales for the year. This increase is based on a 53-week comparison for
both periods. Comparable store net sales are positively affected by our expanded and relocated stores, which we include in the
calculation, and, to a lesser extent, are negatively affected when we open new stores or expand stores near existing ones.
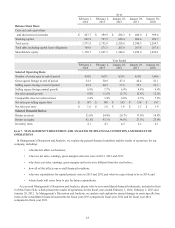
The following table summarizes the components of the changes in our store count for fiscal years ended February 2, 2013
and January 28, 2012.
February 2,
2013
January 28,
2012
New stores 345 278
Expanded or relocated stores 87 91
Closed stores (25)(28)
Prior to fiscal 2012, we did not open new stores or expand stores in the month of January. Of the 345 new stores added in
2012, 25 stores were opened and five were expanded in January 2013. Of the 2.9 million selling square foot increase in 2012
approximately 0.3 million was added by expanding existing stores.
Gross profit. Gross profit margin was 35.9% in 2012 and 2011. Improvement in initial mark-up in many categories and
occupancy and distribution cost leverage were offset by an increase in the mix of higher cost consumer product merchandise
and higher freight costs in fiscal 2012 than in fiscal 2011.
Selling, general and administrative expenses. Selling, general and administrative expenses, as a percentage of net sales,
decreased to 23.5% for 2012 compared to 24.1% for 2011. The decrease is primarily due to the following:
• Payroll expenses decreased 25 basis points due to lower incentive compensation achievement.
• Store operating costs decreased 15 basis points due to lower utility costs and reduced repairs and maintenance expenses.
• Operating and corporate expenses decreased 15 basis points due to a favorable legal settlement and lower debit and
credit fees.
• Depreciation decreased 10 basis points primarily due to the leveraging associated with the increase in comparable store
net sales in the current year and sales in the 53rd week of 2012.
Operating income. Operating income margin was 12.4% in 2012 compared to 11.8% in 2011. Due to the reasons noted
above, operating income margin improved 60 basis points.
Other (income) expense, net. Other (income) expense, net in 2012 includes a $60.8 million gain on the sale of our
investment in Ollie's Holdings, Inc.
Income taxes. Our effective tax rate was 36.7% in 2012 compared to 37.4% in 2011. The rate decrease is the result of
statute expirations and the settlement of state tax audits.
Liquidity and Capital Resources
Our business requires capital to build and open new stores, expand our distribution network and operate and expand
existing stores. Our working capital requirements for existing stores are seasonal and usually reach their peak in September
and October. Historically, we have satisfied our seasonal working capital requirements for existing stores and have funded our
store opening and distribution network expansion programs from internally generated funds and borrowings under our credit
facilities.
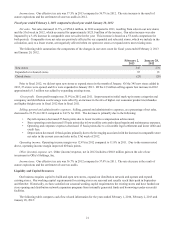
The following table compares cash-flow related information for the years ended February 1, 2014, February 2, 2013 and
January 28, 2012: