Dollar Tree 2013 Annual Report Download - page 54
Download and view the complete annual report
Please find page 54 of the 2013 Dollar Tree annual report below. You can navigate through the pages in the report by either clicking on the pages listed below, or by using the keyword search tool below to find specific information within the annual report.-
 1
1 -
2
-
3
-
4
-
5
-
6
-
7
-
8
-
9
-
10
-
11
-
12
-
13
-
14
-
15
-
16
-
17
-
18
-
19
-
20
-
21
-
22
-
23
-
24
-
25
-
26
-
27
-
28
-
29
-
30
-
31
-
32
-
33
-
34
-
35
-
36
-
37
-
38
-
39
-
40
-
41
-
42
-
43
-
 44
44 -
 45
45 -
 46
46 -
 47
47 -
 48
48 -
 49
49 -
 50
50 -
 51
51 -
 52
52 -
 53
53 -
 54
54 -
 55
55 -
 56
56 -
 57
57 -
 58
58 -
 59
59 -
 60
60 -
 61
61 -
 62
62 -
 63
63 -
 64
64 -
65
-
66
-
67
-
68
-
69
-
70
-
71
-
72
-
73
-
74
-
75
-
76
-
77
-
78
-
79
-
80
-
81
-
82
-
83
-
84
-
85
-
86
-
87
-
88
 |
 |

38
Income Taxes
Income taxes are accounted for under the asset and liability method. Deferred tax assets and liabilities are recognized for
the future tax consequences attributable to differences between financial statement carrying amounts of existing assets and
liabilities and their respective tax bases. Deferred tax assets and liabilities are measured using enacted tax rates expected to
apply to taxable income in the years in which those temporary differences are expected to be recovered or settled. The effect
on deferred tax assets and liabilities of a change in tax rates is recognized in income in the period that includes the enactment
date of such change.
The Company recognizes a financial statement benefit for a tax position if it determines that it is more likely than not that
the position will be sustained upon examination.
The Company includes interest and penalties in the provision for income tax expense and income taxes payable. The
Company does not provide for any penalties associated with tax contingencies unless they are considered probable of
assessment.
Stock-Based Compensation
The Company recognizes expense for all share-based payments to employees based on their fair values. Total stock-based
compensation expense for 2013, 2012 and 2011 was $36.2 million, $34.9 million and $31.0 million, respectively.
The Company recognizes expense related to the fair value of restricted stock units (RSUs) over the requisite service period
on a straight-line basis or a shorter period based on the retirement eligibility of the grantee. The fair value is determined using
the closing price of the Company’s common stock on the date of grant.
Net Income Per Share
Basic net income per share has been computed by dividing net income by the weighted average number of shares
outstanding. Diluted net income per share reflects the potential dilution that could occur assuming the inclusion of dilutive
potential shares and has been computed by dividing net income by the weighted average number of shares and dilutive
potential shares outstanding. Dilutive potential shares include all outstanding stock options and unvested RSUs after applying
the treasury stock method.
NOTE 2 - BALANCE SHEET COMPONENTS
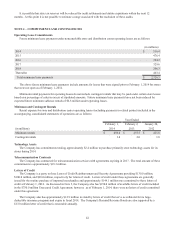
Property, Plant and Equipment, Net
Property, plant and equipment, net, as of February 1, 2014 and February 2, 2013 consists of the following:
February 1, February 2,
(in millions) 2014 2013
Land $ 65.2 $ 51.4
Buildings 319.8 223.9
Leasehold improvements 960.7 876.2
Furniture, fixtures and equipment 1,307.0 1,174.5
Construction in progress 57.4 107.9
Total property, plant and equipment 2,710.1 2,433.9
Less: accumulated depreciation 1,616.1 1,473.2
Total property, plant and equipment, net $ 1,094.0 $ 960.7
Depreciation expense was $190.7 million, $175.4 million and $164.2 million for the years ended February 1, 2014,
February 2, 2013, and January 28, 2012, respectively.