ComEd 2001 Annual Report Download - page 85
Download and view the complete annual report
Please find page 85 of the 2001 ComEd annual report below. You can navigate through the pages in the report by either clicking on the pages listed below, or by using the keyword search tool below to find specific information within the annual report.-
 1
1 -
2
-
3
-
4
-
5
-
6
-
7
-
8
-
9
-
10
-
11
-
12
-
13
-
14
-
15
-
16
-
17
-
18
-
19
-
20
-
21
-
22
-
23
-
24
-
25
-
26
-
27
-
28
-
29
-
30
-
31
-
32
-
33
-
34
-
35
-
36
-
37
-
38
-
39
-
40
-
41
-
42
-
43
-
44
-
45
-
46
-
47
-
48
-
49
-
50
-
51
-
52
-
53
-
54
-
55
-
56
-
57
-
58
-
59
-
60
-
61
-
62
-
63
-
64
-
65
-
66
-
67
-
68
-
69
-
70
-
71
-
72
-
73
-
74
-
 75
75 -
 76
76 -
 77
77 -
 78
78 -
 79
79 -
 80
80 -
 81
81 -
 82
82 -
 83
83 -
 84
84 -
 85
85 -
 86
86 -
 87
87 -
 88
88 -
 89
89 -
 90
90 -
 91
91 -
 92
92 -
 93
93 -
 94
94 -
 95
95 -
96
-
97
-
98
 |
 |

83
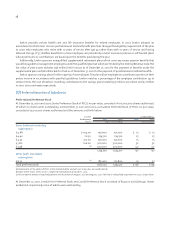
reporting date. Exelon’s interest rate swaps are documented under master agreements. Among other things, these agreements
provide for a maximum credit exposure for both parties. Payments are required by the appropriate party when the maximum
limit is reached. The majority of power purchase and sale contracts are documented under master netting agreements.
On January 1, 2001, Exelon recognized a non-cash gain of $12 million,net of income taxes,in earnings and deferred a non-
cash gain of $44 million, net of income taxes, in accumulated other comprehensive income, a component of shareholders’
equity, to reflect the initial adoption of SFAS No. 133, as amended. SFAS No. 133 must be applied to all derivative instruments
and requires that such instruments be recorded in the balance sheet either as an asset or a liability measured at their fair
value through earnings, with special accounting permitted for certain qualifying hedges.
During 2001, Exelon recognized net gains of $16 million ($10 million, net of income taxes) relating to mark-to-market (MTM)
adjustments of certain non-trading power purchase and sale contracts pursuant to SFAS No. 133. MTM adjustments on power
purchase contracts are reported in fuel and purchased power and MTM adjustments on power sale contracts are reported as
Operating Revenues in the Consolidated Statements of Income. During 2001, Exelon recognized net gains aggregating $14
million ($10 million, net of income taxes) on derivative instruments entered into for trading purposes. Exelon commenced
financial trading in the second quarter of 2001. Gains and losses associated with financial trading are reported as Other Income
and Deductions in the Consolidated Statements of Income.During 2001,no amounts were reclassified from accumulated other
comprehensive income into earnings as a result of forecasted energy commodity transactions no longer being probable. For
2001, a $6 million gain ($4 million, net of income taxes) was reclassified from accumulated other comprehensive income into
earnings as a result of forecasted financing transactions no longer being probable.
As of December 31, 2001, $65 million of deferred net gains on derivative instruments accumulated in other comprehensive
income are expected to be reclassified to earnings during the next twelve months. Amounts in accumulated other
comprehensive income related to interest rate cash flows are reclassified into earnings when the forecasted interest payment
occurs. Amounts in accumulated other comprehensive income related to energy commodity cash flows are reclassified into
earnings when the forecasted purchase or sale of the energy commodity occurs. The majority of Exelon’s cash flow hedges are
expected to settle within the next 3 years.
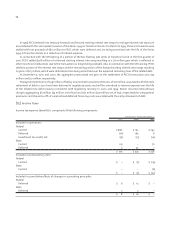
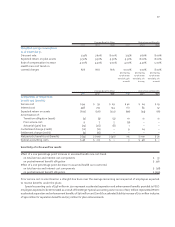
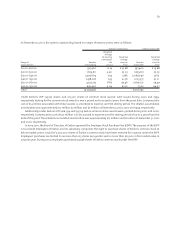
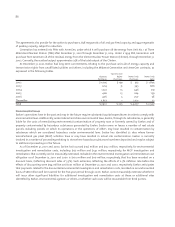
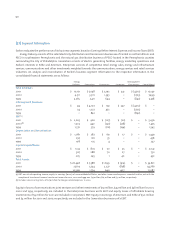
Exelon classifies investments in the trust accounts for decommissioning nuclear plants as available-for-sale. The
following tables show the fair values, gross unrealized gains and losses and amortized costs bases for the securities held in
these trust accounts.
December 31, 2001
Gross Gross
Amortized Unrealized Unrealized Estimated
Cost Gains Losses Fair Value
Equity securities $ 1,666 $ 130 $ (236) $ 1,560
Debt securities
Government obligations 882 28 (3) 907
Other debt securities 701 16 (19) 698
Total debt securities 1,583 44 (22) 1,605
Total available-for-sale securities $ 3,249 $ 174 $ (258) $ 3,165
December 31, 2000
Gross Gross
Amortized Unrealized Unrealized Estimated
Cost Gains Losses Fair Value
Equity securities $ 1,702 $ 144 $ (180) $ 1,666
Debt securities
Government obligations 932 40 – 972
Other debt securities 470 8 (7) 471
Total debt securities 1,402 48 (7) 1,443
Total available-for-sale securities $ 3,104 $ 192 $ (187) $3,109