ComEd 2001 Annual Report Download - page 43
Download and view the complete annual report
Please find page 43 of the 2001 ComEd annual report below. You can navigate through the pages in the report by either clicking on the pages listed below, or by using the keyword search tool below to find specific information within the annual report.-
 1
1 -
2
-
3
-
4
-
5
-
6
-
7
-
8
-
9
-
10
-
11
-
12
-
13
-
14
-
15
-
16
-
17
-
18
-
19
-
20
-
21
-
22
-
23
-
24
-
25
-
26
-
27
-
28
-
29
-
30
-
31
-
32
-
 33
33 -
 34
34 -
 35
35 -
 36
36 -
 37
37 -
 38
38 -
 39
39 -
 40
40 -
 41
41 -
 42
42 -
 43
43 -
 44
44 -
 45
45 -
 46
46 -
 47
47 -
 48
48 -
 49
49 -
 50
50 -
 51
51 -
 52
52 -
 53
53 -
54
-
55
-
56
-
57
-
58
-
59
-
60
-
61
-
62
-
63
-
64
-
65
-
66
-
67
-
68
-
69
-
70
-
71
-
72
-
73
-
74
-
75
-
76
-
77
-
78
-
79
-
80
-
81
-
82
-
83
-
84
-
85
-
86
-
87
-
88
-
89
-
90
-
91
-
92
-
93
-
94
-
95
-
96
-
97
-
98
 |
 |

41
Management uses its best estimates to determine the fair value of commodity and derivative contracts it holds and sells.
These estimates consider various factors including closing exchange and over-the-counter price quotations, time value,
volatility factors, and credit exposure. However, it is possible that future market prices could vary from those used in
recording assets and liabilities from energy marketing and trading activities, and such variations could be material.
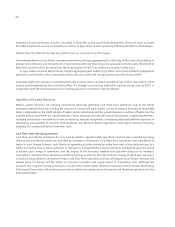
Credit Risk
ComEd and PECO are each obligated to provide service to all electric customers within their respective franchised territories.
As a result, ComEd and PECO each have a broad customer base. For the year ended December 31, 2001, ComEd’s ten largest
customers represented approximately 3% of its retail electric revenues and PECO’s ten largest customers represented
approximately 10% of its retail electric revenues. Credit risk for Energy Delivery is managed by each company’s credit and
collection policies, which are consistent with state regulatory requirements.
Generation has credit risk associated with counterparty performance which includes but is not limited to the risk of
financial default or slow payment. Counterparty credit risk is managed through established policies, including establishing
counterparty credit limits, and in some cases, requiring deposits and letters of credit to be posted by certain counterparties.
Generation’s counterparty credit limits are based on a scoring model that considers a variety of factors, including leverage,
liquidity, profitability, credit ratings and risk management capabilities. Generation has entered into master netting
agreements with the majority of its large counterparties, which reduce exposure to risk by providing for the offset of
amounts payable to the counterparty against the counterparty receivables.
Generation participates in the five established, real-time energy markets, which are administered by independent
system operators (ISOs): Pennsylvania, New Jersey, Maryland, LLC (PJM), which is in the Mid-Atlantic Area Council region:
New England and New York, which are both in the Northeast Power Coordinating Council region, California, which is in the
Western Systems Coordinating Council region and Texas, which is administered by the Electric Reliability Council of Texas.
Approximately one-half of Generation’s transactions, on a megawatthour basis, were made in these markets. In these areas,
power is traded through bilateral agreements between buyers and sellers and on the spot markets which are operated by
the ISOs. In areas where there is no spot market, electricity is purchased and sold solely through bilateral agreements. For
sales into the spot markets administered by the ISOs, the ISO maintains financial assurance policies that are established
and enforced by those administrators. The credit policies of the ISO’s may under certain circumstances require that losses
arising from the default of one member on spot market transactions be shared by the remaining participants. Non-
performance or non-payment by a major counterparty, could result in a material adverse impact on Exelon’s financial
condition, results of operations or net cash flows.
Exelon’s balance sheet includes a $427 million net investment in a direct financing lease as of December 31, 2001. The
investment in direct financing leases represents future minimum lease payments due at the end of the thirty year life of
the lease of $1,492 million, less unearned income of $1,065 million. The future minimum lease payments are supported by
collateral and credit enhancement measures including letters of credit, surety bonds and credit swaps issued by high credit
quality financial institutions.
Interest Rate Risk
Exelon uses a combination of fixed rate and variable rate debt to reduce interest rate exposure. Interest rate swaps may be
used to adjust exposure when deemed appropriate based upon market conditions. Exelon also utilizes forward-starting
interest rate swaps and treasury rate locks to lock in interest rate levels in anticipation of future financing. These strategies
are employed to maintain the lowest cost of capital. As of December 31, 2001, a hypothetical 10% increase in the interest
rates associated with variable rate debt would result in an $1 million decrease in pre-tax earnings for 2002.
Exelon has entered into interest rate swaps to manage interest rate exposure associated with the floating rate series of
transition bonds issued to securitize PECO’s stranded cost recovery and with a $235 million fixed-rate obligation of ComEd.
In December 2001, Exelon entered into forward-starting interest rate swaps, with an aggregate notional amount of $250
million in anticipation of the issuance of debt at ComEd in the first quarter of 2002. At December 31, 2001, these interest
rate swaps had an aggregate fair market value exposure of $21 million based on the present value difference between the
contract and market rates at December 31, 2001.