ComEd 2001 Annual Report Download - page 27
Download and view the complete annual report
Please find page 27 of the 2001 ComEd annual report below. You can navigate through the pages in the report by either clicking on the pages listed below, or by using the keyword search tool below to find specific information within the annual report.-
 1
1 -
2
-
3
-
4
-
5
-
6
-
7
-
8
-
9
-
10
-
11
-
12
-
13
-
14
-
15
-
16
-
 17
17 -
 18
18 -
 19
19 -
 20
20 -
 21
21 -
 22
22 -
 23
23 -
 24
24 -
 25
25 -
 26
26 -
 27
27 -
 28
28 -
 29
29 -
 30
30 -
 31
31 -
 32
32 -
 33
33 -
 34
34 -
 35
35 -
 36
36 -
 37
37 -
38
-
39
-
40
-
41
-
42
-
43
-
44
-
45
-
46
-
47
-
48
-
49
-
50
-
51
-
52
-
53
-
54
-
55
-
56
-
57
-
58
-
59
-
60
-
61
-
62
-
63
-
64
-
65
-
66
-
67
-
68
-
69
-
70
-
71
-
72
-
73
-
74
-
75
-
76
-
77
-
78
-
79
-
80
-
81
-
82
-
83
-
84
-
85
-
86
-
87
-
88
-
89
-
90
-
91
-
92
-
93
-
94
-
95
-
96
-
97
-
98
 |
 |

25
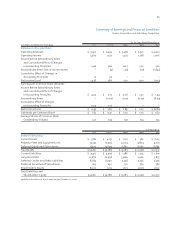
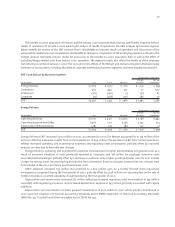
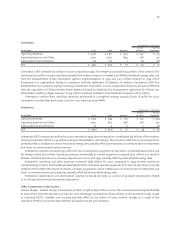
Summary of Earnings and Financial Condition
Exelon Corporation and Subsidiary Companies
For the Years Ended December 31,
in millions, except for per share data 2001 2000(a) 1999 1998 1997
Statement of Income Data:
Operating Revenues $ 15,140 $ 7,499 $ 5,478 $ 5,325 $ 4,601
Operating Income 3,362 1,527 1,373 1,268 1,006
Income before Extraordinary Items
and Cumulative Effect of Changes
in Accounting Principles 1,416 566 607 520 320
Extraordinary Items (net of income taxes) – (4) (37) (20) (1,834)
Cumulative Effect of Changes in
Accounting Principles 12 24 – – –
Net Income (Loss) 1,428 586 570 500 (1,514)
Earnings per Common Share (Diluted):
Income Before Extraordinary Items
and Cumulative Effect of Changes
in Accounting Principles $ 4.39 $ 2.77 $ 3.08 $ 2.32 $ 1.44
Extraordinary Items – (0.02) (0.19) (0.09) (8.24)
Cumulative Effect of Changes
in Accounting Principles 0.04 0.12 – – –
Net Income (Loss) $ 4.43 $ 2.87 $ 2.89 $ 2.23 $ (6.80)
Dividends per Common Share $ 1.82 $ 0.91 $ 1.00 $ 1.00 $ 1.80
Average Shares of Common Stock
Outstanding–Diluted 322 204 197 224 223
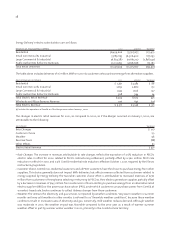
at December 31,
2001 2000(a) 1999 1998 1997
Balance Sheet Data:
Current Assets $ 3,782 $ 4,151 $ 1,221 $ 582 $ 1,003
Property, Plant and Equipment, net 13,742 12,936 5,004 4,804 4,671
Deferred Debits and Other Assets 17,297 17,699 6,862 6,662 6,683
Total Assets $ 34,821 $ 34,786 $ 13,087 $ 12,048 $ 12,357
Current Liabilities $ 4,417 $ 4,993 $ 1,286 $ 1,735 $ 1,619
Long-Term Debt 12,876 12,958 5,969 2,920 3,853
Deferred Credits and Other Liabilities 8,685 8,990 3,738 3,756 3,576
Preferred Securities of Subsidiaries 613 630 321 579 582
Shareholders’ Equity 8,230 7,215 1,773 3,058 2,727
Total Liabilities and
Shareholders’ Equity $34,821 $ 34,786 $ 13,087 $ 12,048 $ 12,357
(a)Reflects the effects of the Unicom Merger (October 20, 2000).