ComEd 2001 Annual Report Download - page 77
Download and view the complete annual report
Please find page 77 of the 2001 ComEd annual report below. You can navigate through the pages in the report by either clicking on the pages listed below, or by using the keyword search tool below to find specific information within the annual report.-
 1
1 -
2
-
3
-
4
-
5
-
6
-
7
-
8
-
9
-
10
-
11
-
12
-
13
-
14
-
15
-
16
-
17
-
18
-
19
-
20
-
21
-
22
-
23
-
24
-
25
-
26
-
27
-
28
-
29
-
30
-
31
-
32
-
33
-
34
-
35
-
36
-
37
-
38
-
39
-
40
-
41
-
42
-
43
-
44
-
45
-
46
-
47
-
48
-
49
-
50
-
51
-
52
-
53
-
54
-
55
-
56
-
57
-
58
-
59
-
60
-
61
-
62
-
63
-
64
-
65
-
66
-
 67
67 -
 68
68 -
 69
69 -
 70
70 -
 71
71 -
 72
72 -
 73
73 -
 74
74 -
 75
75 -
 76
76 -
 77
77 -
 78
78 -
 79
79 -
 80
80 -
 81
81 -
 82
82 -
 83
83 -
 84
84 -
 85
85 -
 86
86 -
 87
87 -
88
-
89
-
90
-
91
-
92
-
93
-
94
-
95
-
96
-
97
-
98
 |
 |

75
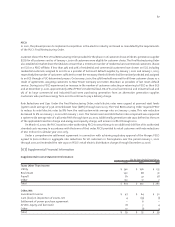
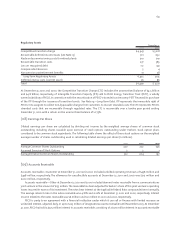
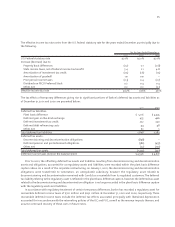
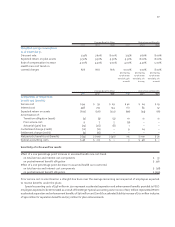
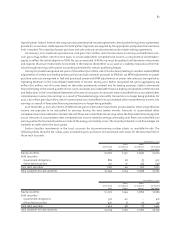
The effective income tax rate varies from the U.S. Federal statutory rate for the years ended December 31 principally due to
the following:
For the Years Ended December 31,
2001 2000 1999
U.S. Federal statutory rate 35.0% 35.0% 35.0%
Increase (decrease) due to:
Property basis differences (0.2) 0.1 (0.8)
State income taxes, net of Federal income tax benefit 3.4 2.1 4.8
Amortization of investment tax credit (0.5) (1.6) (1.5)
Amortization of goodwill 1.9 0.9 –
Prior period income taxes (0.3) 0.4 (0.7)
Dividends on PECO Preferred Stock 0.2 0.4 0.4
Other, net 0.2 0.3 (0.1)
Effective income tax rate 39.7% 37.6% 37.1%
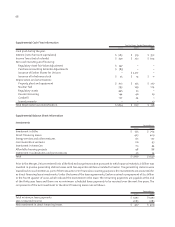
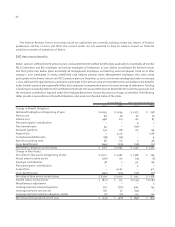
The tax effects of temporary differences giving rise to significant portions of Exelon’s deferred tax assets and liabilities as
of December 31, 2001 and 2000 are presented below:
2001 2000
Deferred tax liabilities:
Plant basis difference $ 5,116 $ 4,535
Deferred gain on like-kind exchange 453 466
Deferred investment tax credit 222 330
Deferred debt refinancing costs 44 48
Other, net 63 5
Total deferred tax liabilities 5,898 5,384
Deferred tax assets:
Decommissioning and decontamination obligations (898) –
Deferred pension and postretirement obligations (382) (437)
Other, net (22) (270)
Total deferred tax assets (1,302) (707)
Deferred income taxes (net) on the balance sheet $ 4,596 $ 4,677
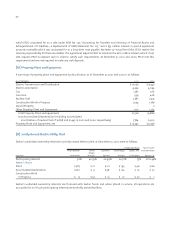
Prior to 2001, the offsetting deferred tax assets and liabilities resulting from decommissioning and decontamination
assets and obligations, accounted for as regulatory assets and liabilities, were recorded within the plant basis difference
caption above. As a result of the corporate restructuring, on January 1, 2001, the decommissioning and decontamination
obligations were transferred to Generation, an unregulated subsidiary; however the regulatory asset related to
decommissioning and decontamination remained with ComEd as a receivable from its regulated customers. The deferred
tax liability relating to the regulatory asset is reflected in the plant basis difference caption, however, the deferred tax asset
related to the decommissioning and decontamination obligation is no longer recorded in the plant basis difference caption
with the regulatory assets and liabilities.
In accordance with regulatory treatment of certain temporary differences, Exelon has recorded a regulatory asset for
recoverable deferred income taxes of $701 million and $632 million at December 31, 2001 and 2000, respectively. These
recoverable deferred income taxes include the deferred tax effects associated principally with liberalized depreciation
accounted for in accordance with the ratemaking policies of the ICC and PUC, as well as the revenue impacts thereon, and
assume continued recovery of these costs in future rates.