ComEd 2001 Annual Report Download - page 30
Download and view the complete annual report
Please find page 30 of the 2001 ComEd annual report below. You can navigate through the pages in the report by either clicking on the pages listed below, or by using the keyword search tool below to find specific information within the annual report.-
 1
1 -
2
-
3
-
4
-
5
-
6
-
7
-
8
-
9
-
10
-
11
-
12
-
13
-
14
-
15
-
16
-
17
-
18
-
19
-
 20
20 -
 21
21 -
 22
22 -
 23
23 -
 24
24 -
 25
25 -
 26
26 -
 27
27 -
 28
28 -
 29
29 -
 30
30 -
 31
31 -
 32
32 -
 33
33 -
 34
34 -
 35
35 -
 36
36 -
 37
37 -
 38
38 -
 39
39 -
 40
40 -
41
-
42
-
43
-
44
-
45
-
46
-
47
-
48
-
49
-
50
-
51
-
52
-
53
-
54
-
55
-
56
-
57
-
58
-
59
-
60
-
61
-
62
-
63
-
64
-
65
-
66
-
67
-
68
-
69
-
70
-
71
-
72
-
73
-
74
-
75
-
76
-
77
-
78
-
79
-
80
-
81
-
82
-
83
-
84
-
85
-
86
-
87
-
88
-
89
-
90
-
91
-
92
-
93
-
94
-
95
-
96
-
97
-
98
 |
 |

28
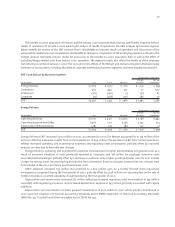
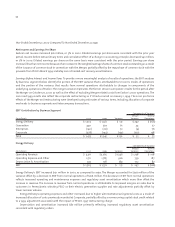
Energy Delivery’s electric sales statistics are as follows:
Deliveries (in megawatthours (MWh)) 2001 2000(a) Variance
Residential 36,459,606 35,307,675 1,151,931
Small Commercial & Industrial 37,183,693 36,506,400 677,293
Large Commercial & Industrial 36,824,787 39,663,127 (2,838,340)
Public Authorities & Electric Railroads 10,003,853 9,828,668 175,185
Total Retail Deliveries 120,471,939 121,305,870 (833,931)
The table above includes deliveries of 16 million MWhs in 2001 to customers who purchase energy from alternative suppliers.
Electric Revenue (in millions) 2001 2000(a) Variance
Residential $3,571 $3,483 $ 88
Small Commercial & Industrial 2,852 2,680 172
Large Commercial & Industrial 1,933 1,796 137
Public Authorities & Electric Railroads 568 544 24
Total Electric Retail Revenue 8,924 8,503 421
Wholesale and Miscellaneous Revenue 593 643 (50)
Total Electric Revenue $ 9,517 $ 9,146 $ 371
(a) Includes the operations of ComEd as if the Merger occurred on January 1, 2000.
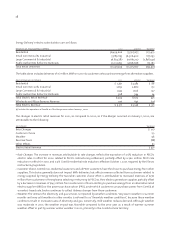
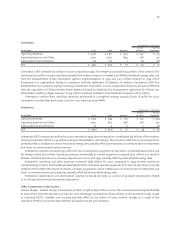
The changes in electric retail revenues for 2001, as compared to 2000, as if the Merger occurred on January 1, 2000, are
attributable to the following:
(in millions) Variance
Rate Changes $217
Customer Choice 131
Weather 98
Revenue Taxes (88)
Other Effects 63
Electric Retail Revenue $ 421
– Rate Changes. The increase in revenues attributable to rate changes reflects the expiration of a 6% reduction in PECO’s
electric rates in effect for 2000 related to PECO’s restructuring settlement, partially offset by a $60 million PECO rate
reduction in effect for 2001, and a 5% ComEd residential rate reduction, effective October 1, 2001, required by the Illinois
restructuring legislation.
– Customer Choice. ComEd non-residential customers and all PECO customers have the choice to purchase energy from other
suppliers. This choice generally does not impact kWh deliveries, but affects revenue collected from customers related to
energy supplied by Energy Delivery. The favorable customer choice effect is attributable to increased revenues of $276
million from customers in Pennsylvania selecting or returning to PECO as their electric generation supplier, partially offset
by a decrease in revenues of $145 million from customers in Illinois electing to purchase energy from an alternative retail
electric supplier (ARES) or the power purchase option (PPO), under which customers can purchase power from ComEd at
a market- based rate. Exelon continues to collect delivery charges from these customers.
– Weather. The demand for electricity and gas services is impacted by weather conditions. Very warm weather in summer
months and very cold weather in other months is referred to as “favorable weather conditions”, because these weather
conditions result in increased sales of electricity and gas. Conversely, mild weather reduces demand. Although weather
was moderate in 2001, the weather impact was favorable compared to the prior year as a result of warmer summer
weather offset in part by warmer winter weather in 2001, primarily in the ComEd service territory.