ComEd 2001 Annual Report Download - page 31
Download and view the complete annual report
Please find page 31 of the 2001 ComEd annual report below. You can navigate through the pages in the report by either clicking on the pages listed below, or by using the keyword search tool below to find specific information within the annual report.-
 1
1 -
2
-
3
-
4
-
5
-
6
-
7
-
8
-
9
-
10
-
11
-
12
-
13
-
14
-
15
-
16
-
17
-
18
-
19
-
20
-
 21
21 -
 22
22 -
 23
23 -
 24
24 -
 25
25 -
 26
26 -
 27
27 -
 28
28 -
 29
29 -
 30
30 -
 31
31 -
 32
32 -
 33
33 -
 34
34 -
 35
35 -
 36
36 -
 37
37 -
 38
38 -
 39
39 -
 40
40 -
 41
41 -
42
-
43
-
44
-
45
-
46
-
47
-
48
-
49
-
50
-
51
-
52
-
53
-
54
-
55
-
56
-
57
-
58
-
59
-
60
-
61
-
62
-
63
-
64
-
65
-
66
-
67
-
68
-
69
-
70
-
71
-
72
-
73
-
74
-
75
-
76
-
77
-
78
-
79
-
80
-
81
-
82
-
83
-
84
-
85
-
86
-
87
-
88
-
89
-
90
-
91
-
92
-
93
-
94
-
95
-
96
-
97
-
98
 |
 |

29
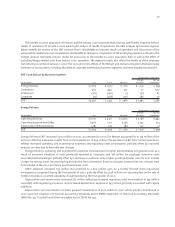
– Revenue taxes. The change in revenue taxes represents a change in presentation of certain revenue taxes from operating
revenue and tax expense to collections recorded as liabilities resulting from Illinois legislation. This change in presentation
does not affect income.
– Other Effects. A strong housing construction market in Chicago has contributed to residential and small commercial and
industrial customer volume growth, partially offset by the unfavorable impact of a slower economy on large commercial and
industrial customers.
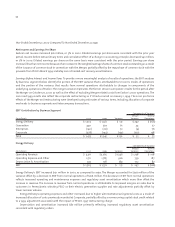
The reduction in Wholesale and Miscellaneous revenues in 2001, as compared to 2000, reflects lower off-system sales
due to the expiration of wholesale contracts that were offered by ComEd from June 2000 to May 2001 to support the open
access program in Illinois, partially offset by increased transmission service revenue and the reversal of a $15 million reserve
for revenue refunds to ComEd’s municipal customers as a result of a favorable Federal Energy Regulatory Commission
(FERC) ruling.
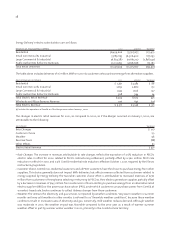
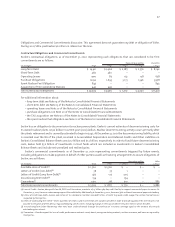
Energy Delivery’s gas sales statistics are as follows:
2001 2000 Variance
Deliveries in million cubic feet (mmcf) 81,528 91,686 (10,158)
Revenue (in millions) $ 654 $ 532 $ 122
The changes in gas revenue for 2001, as compared to 2000, are as follows:
(in millions) Variance
Price $174
Weather (38)
Volume (14)
Gas Revenue $122
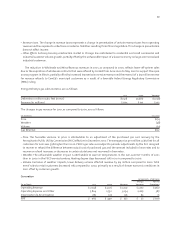
– Price. The favorable variance in price is attributable to an adjustment of the purchased gas cost recovery by the
Pennsylvania Public Utility Commission (PUC) effective in December 2000. The average price per million cubic feet for all
customers for 2001 was 39% higher than 2000. PECO’s gas rates are subject to periodic adjustments by the PUC designed
to recover or refund the difference between actual cost of purchased gas and the amount included in base rates and to
recover or refund increases or decreases in certain state taxes not recovered in base rates.
– Weather. The unfavorable weather impact is attributable to warmer temperatures in the non-summer months of 2001
than in 2000 in the PECO service territory. Heating degree days decreased 12% in 2001 compared to 2000.
– Volume. Exclusive of weather impacts, lower delivery volume affected revenue by $14 million compared to 2000. Total
mmcf sales to retail customers decreased 11% compared to 2000, primarily as a result of slower economic conditions in
2001 offset by customer growth.
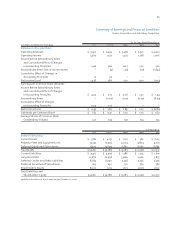
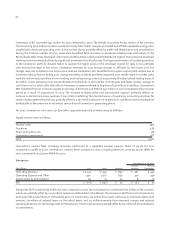
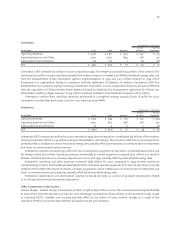
Generation
Components of Variance
Merger Normal
(in millions) 2001 2000 Variance Variance Operations
Operating Revenue $ 7,048 $ 3,316 $ 3,732 $ 2,772 $ 960
Operating Expense and Other 5,804 2,750 3,054 2,667 387
Depreciation & Amortization 282 126 156 83 73
EBIT $ 962 $ 440 $ 522 $ 22 $ 500