Albertsons 2011 Annual Report Download - page 69
Download and view the complete annual report
Please find page 69 of the 2011 Albertsons annual report below. You can navigate through the pages in the report by either clicking on the pages listed below, or by using the keyword search tool below to find specific information within the annual report.-
 1
1 -
2
-
3
-
4
-
5
-
6
-
7
-
8
-
9
-
10
-
11
-
12
-
13
-
14
-
15
-
16
-
17
-
18
-
19
-
20
-
21
-
22
-
23
-
24
-
25
-
26
-
27
-
28
-
29
-
30
-
31
-
32
-
33
-
34
-
35
-
36
-
37
-
38
-
39
-
40
-
41
-
42
-
43
-
44
-
45
-
46
-
47
-
48
-
49
-
50
-
51
-
52
-
53
-
54
-
55
-
56
-
57
-
58
-
 59
59 -
 60
60 -
 61
61 -
 62
62 -
 63
63 -
 64
64 -
 65
65 -
 66
66 -
 67
67 -
 68
68 -
 69
69 -
 70
70 -
 71
71 -
 72
72 -
 73
73 -
 74
74 -
 75
75 -
 76
76 -
 77
77 -
 78
78 -
 79
79 -
80
-
81
-
82
-
83
-
84
-
85
-
86
-
87
-
88
-
89
-
90
-
91
-
92
 |
 |

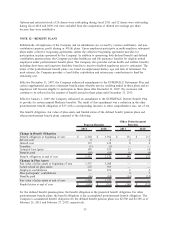
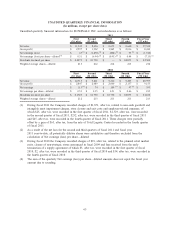
UNAUDITED QUARTERLY FINANCIAL INFORMATION
(In millions, except per share data)
Unaudited quarterly financial information for SUPERVALU INC. and subsidiaries is as follows:
First
(16 wks)
Second
(12 wks)
Third
(12 wks)
Fourth
(12 wks)
Fiscal Year
(52 wks)
2011
Net sales $ 11,545 $ 8,656 $ 8,673 $ 8,660 $ 37,534
Gross profit $ 2,597 $ 1,932 $ 1,865 $ 2,016 $ 8,410
Net earnings (loss) $ 67
(1)
$ (1,470)
(1)
$ (202)
(1)
$95
(1)
$ (1,510)
Net earnings (loss) per share—diluted
(4)
$ 0.31 $ (6.94)
(2)
$ (0.95)
(2)
$ 0.44 $ (7.13)
(2)
Dividends declared per share $ 0.0875 $ 0.1750 $ — $ 0.0875 $ 0.3500
Weighted average shares—diluted 213 212 212 213 212
First
(16 wks)
Second
(12 wks)
Third
(12 wks)
Fourth
(12 wks)
Fiscal Year
(52 wks)
2010
Net sales $ 12,715 $ 9,461 $ 9,216 $ 9,205 $ 40,597
Gross profit $ 2,847 $ 2,089 $ 2,060 $ 2,157 $ 9,153
Net earnings $ 113
(3)
$ 74 $ 109
(3)
$97
(3)
$ 393
Net earnings per share—diluted $ 0.53 $ 0.35 $ 0.51 $ 0.46 $ 1.85
Dividends declared per share $ 0.1725 $ 0.1750 $ 0.1750 $ 0.0875 $ 0.6100
Weighted average shares—diluted 212 213 213 213 213
(1) During fiscal 2011 the Company recorded charges of $1,871, after tax, related to non-cash goodwill and
intangible asset impairment charges, store closure and exit costs and employee-related expenses, of
which $25, after tax, were recorded in the first quarter of fiscal 2011, $1,529, after tax, were recorded
in the second quarter of fiscal 2011, $252, after tax, were recorded in the third quarter of fiscal 2011
and $65, after tax, were recorded in the fourth quarter of fiscal 2011. These charges were partially
offset by a gain of $65, after tax, from the sale of Total Logistic Control recorded in the fourth quarter
of fiscal 2011.
(2) As a result of the net loss for the second and third quarters of fiscal 2011 and fiscal year
2011 year-to-date, all potentially dilutive shares were antidilutive and therefore excluded from the
calculation of Net earnings (loss) per share—diluted.
(3) During fiscal 2010 the Company recorded charges of $39, after tax, related to the planned retail market
exits, closure of non-strategic stores announced in fiscal 2009 and fees received from the early
termination of a supply agreement of which $3, after tax, were recorded in the first quarter of fiscal
2010, $2, after tax, were recorded in the third quarter of fiscal 2010 and $34, after tax, were recorded in
the fourth quarter of fiscal 2010.
(4) The sum of the quarterly Net earnings (loss) per share—diluted amounts does not equal the fiscal year
amount due to rounding.
65